PROVISIONAL DATA SUBJECT TO REVISION
Click to hidestation-specific text
Funding for this site is provided by:
 Site Information
LOCATION.--Lat 42°17'30.6", long
75°28'36.4" referenced to North American Datum of
1983, Chenango County, NY, Hydrologic Unit 02050101, on right
bank downstream from bridge on State Highway 206, at
Bainbridge.
DRAINAGE AREA.--1,610 mi².
PERIOD OF RECORD.--Annual maximum only--1988-2009, October 2009 to current year.
GAGE.--Water-stage recorder. Datum of gage is 956.55 ft above NGVD of 1929 and 956.14 ft above NAVD of 1988.
REMARKS.--Minor regulation by upstream lakes and reservoirs.
Water Years 2014-15: Records good except those for estimated daily discharges, which are fair.
Water Years 2016-23: Records fair except those for estimated daily discharges, which are poor.
EXTREMES FOR PERIOD OF RECORD.--Maximum discharge, 58,700 ft³/s, June 29, 2006, gage height, 27.05 ft; minimum discharge, 223 ft³/s, Aug. 22, 23, 2022, gage height, 0.92 ft; minimum gage height, 0.82 ft, Aug. 27, 2012.
 WaterAlert – get an
email or text (SMS) alert based on your chosen threshold.
WaterAlert – get an
email or text (SMS) alert based on your chosen threshold.
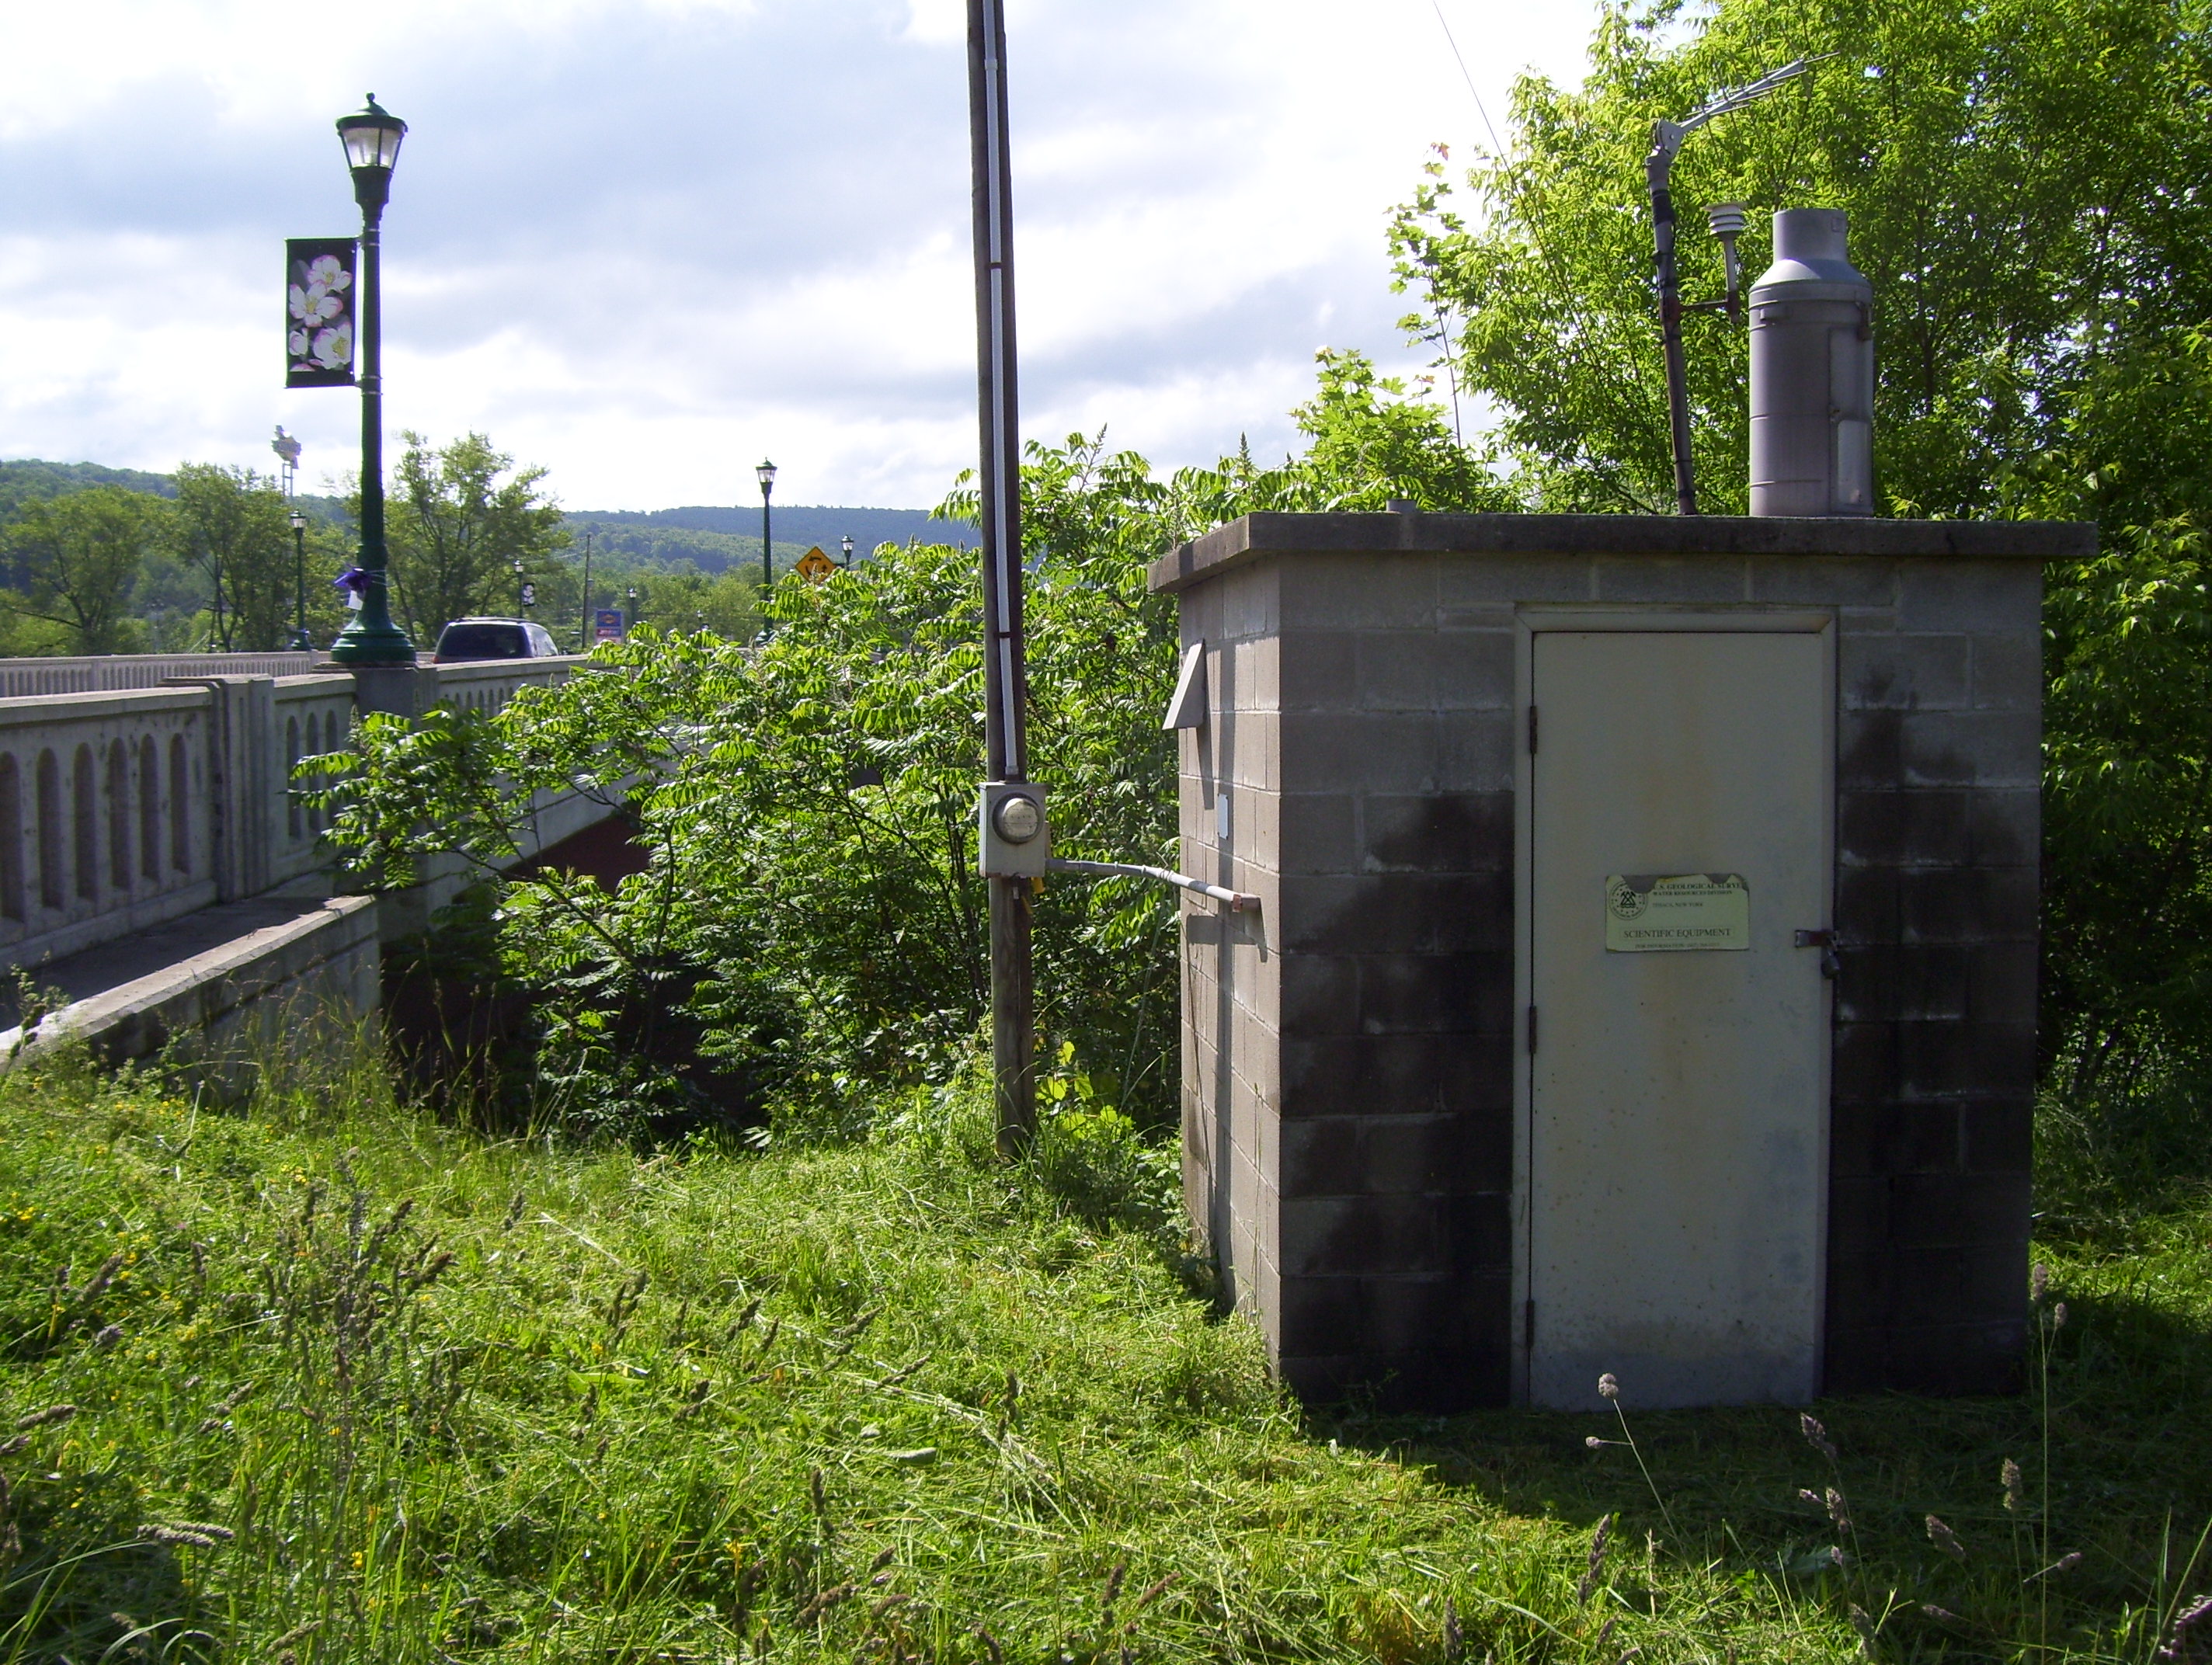 Station image
Summary of all available data for this site
Instantaneous-data availability statement

