PROVISIONAL DATA SUBJECT TO REVISION
Click to hidestation-specific text
Funding for this site is provided by:
 Site Information
LOCATION.--Lat 42°05'46.1", long
76°15'56.5" referenced to North American Datum of
1983, Tioga County, NY, Hydrologic Unit 02050103, on right bank
in pump house for village sewage treatment plant, 0.4 mi
downstream from bridge on State Highway 96, at Owego.
DRAINAGE AREA.--4,216 mi².
PERIOD OF RECORD.--Annual maximum only--1988-96, 1999-2009, October 2009 to current year.
REVISIONS HISTORY.--WDR NY-89-3: 1988 (M). WDR NY-04-3: 2002-03 (M). WDR-US-2006: 2002-05 (M). 1999(M), 2000(M).
GAGE.--Water-stage recorder and crest-stage gage. Datum of gage is 776.64 ft above NGVD of 1929 and 776.09 ft above NAVD of 1988.
REMARKS.--Minor regulation by upstream lakes and reservoirs.
Water Year 2014: Records good except those for estimated daily discharges, which are fair.
Water Year 2015: Records fair except those for estimated daily discharges, which are poor.
Water Years 2016-23: Records good except those for estimated daily discharges, which are poor.
EXTREMES FOR PERIOD OF RECORD.--Maximum discharge, 159,000 ft³/s, Sept 8, 2011, gage height 39.62 ft, from floodmark on pump house; minimum discharge, 455 ft³/s, Sept. 26, 2020; minimum gage height, 12.92 ft, Sept. 26, 27, 2010.
EXTREMES OUTSIDE PERIOD OF RECORD.--Maximum discharge, 107,000 ft³/s, Mar. 18, 1936, provided by the U.S. Army Corps of Engineers.
 WaterAlert – get an
email or text (SMS) alert based on your chosen threshold.
WaterAlert – get an
email or text (SMS) alert based on your chosen threshold.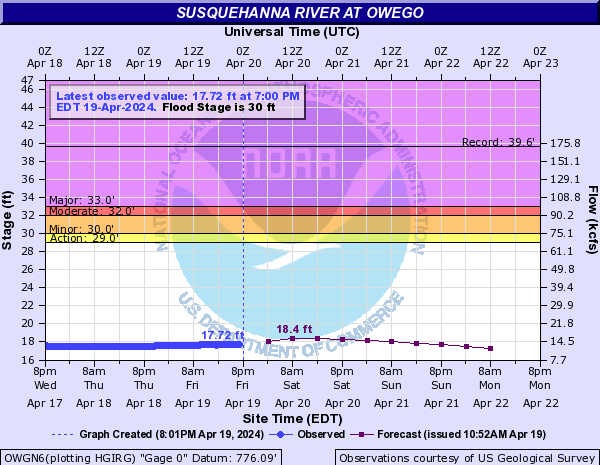
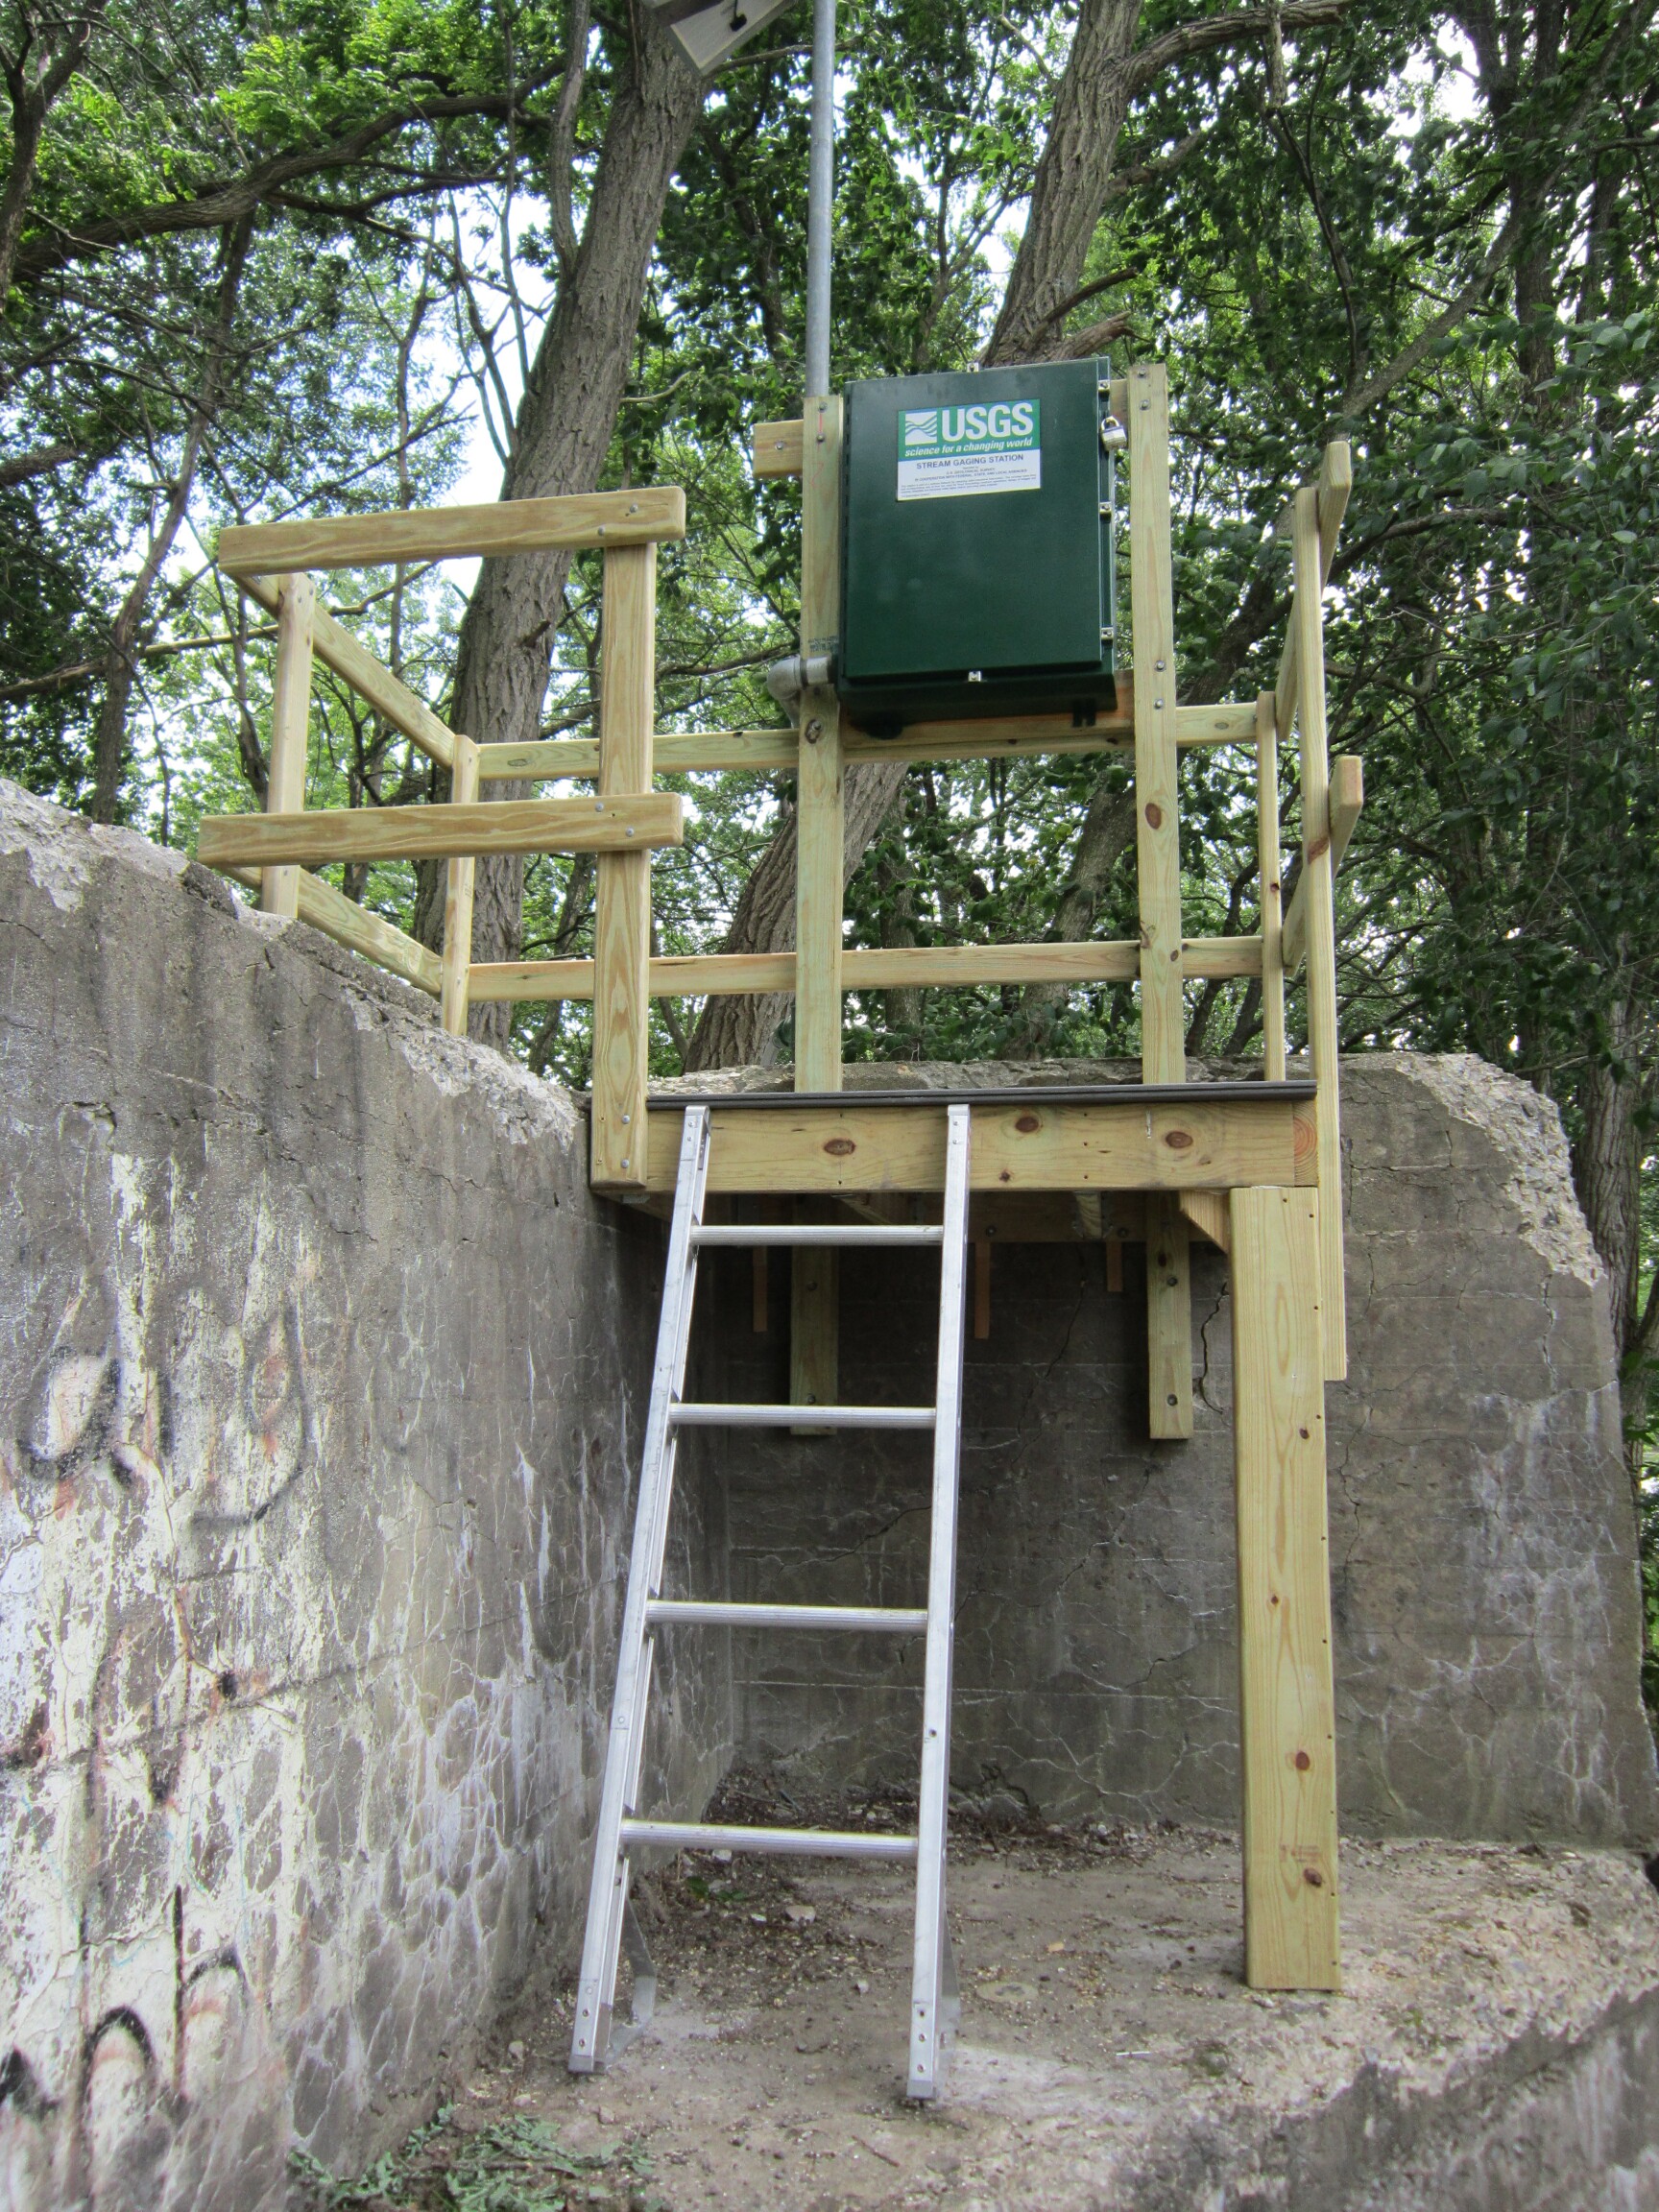 Station image
Summary of all available data for this site
Instantaneous-data availability statement

