PROVISIONAL DATA SUBJECT TO REVISION
Click to hidestation-specific text
Funding for this site is provided by:
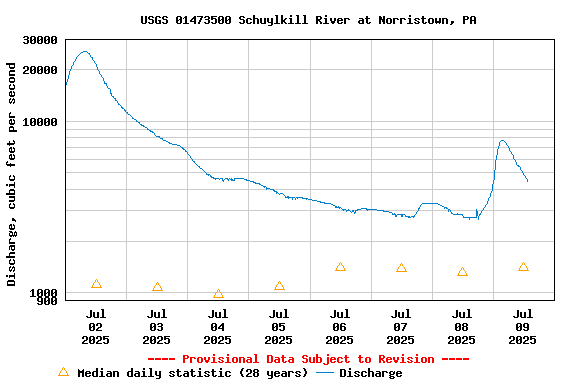
 STATION.--01473500 SCHUYLKILL RIVER AT NORRISTOWN,
PA
STATION.--01473500 SCHUYLKILL RIVER AT NORRISTOWN,
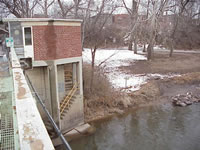
PALOCATION.--Lat 40`06'56", long 75`21'22", Montgomery County, Hydrologic Unit 02040203, at Haws Avenue bridge leading to Barbadoes Island, 0.2 mi upstream from Stony Creek 0.6 mi upstream from Norristown Dam at Norristown.
DRAINAGE AREA.--1,760 square miles. Reported drainage area includes that of Stony Creek which enters the gage pool 1200 ft downstream of gage.
PERIOD OF RECORD.--August 2001 to current year. October 1927 to May 1933, at site 0.6 miles downstream, at different datum. October 1983 to September 1993, annual maximums from crest-stage gage located 0.7 miles downstream, at different datum.
GAGE.--Water-stage recorder, water-quality, and Pluvio precipitation gage. monitor. Datum of gage is 51 ft above National Geodetic Vertical Datum of 1929, from topographic map. Satellite telemetry at station.
COOPERATION.--Funding for the operation of this station is provided by the U.S. Geological Survey and the U.S. Army Corps of Engineers, Philadelphia District. Funding for operation of the water-quality monitor is provided by the City of Philadelphia, Water Department.
REMARKS.--
| The 15-minute precipitation data for this station are temporary and will only be displayed for 120 days. Time series of 1-hour or cumulative daily values will NOT be available for retrieval following the 120-day display period. Although the instrumentation is calibrated at least once a year, the temporary classification means that documented routine inspections and other quality assurance measures are not performed that would make the data acceptable for archival, retrieval, or future use in general scientific or interpretive studies. |
GAGE HEIGHTS OF IMPORTANCE.-
Supplied by NWS: Action stage-12 ft; Flood stage-13 ft; Moderate flood stage-17 ft; Major flood stage-19 ft.
Summary of all available data for this site
Instantaneous-data availability statement