USGS 01553025 West Branch Susquehanna River at Allenwood, PA

PROVISIONAL DATA SUBJECT TO REVISION

Click to hidestation-specific text
Funding for this site is provided by:


Station gage imageSTATION.--01553025 WEST BRANCH SUSQUEHANNA RIVER AT
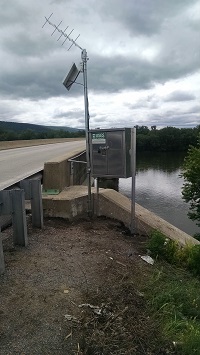
 ALLENWOOD, PA
LOCATION.--Lat 41`06'29", long 76`53'24", Union County, Hydrologic Unit 02050206, on left bank, on upstream side of bridge on State Route 44 near Allenwood, PA.
DRAINAGE AREA.--6,496 square miles.
PERIOD OF RECORD.--Water-quality sample, June 2008; Continuous stage/ discharge from July 2015 to current year.
GAGE.--Water-stage recorder, crest-stage gage, and radar unit. Datum of gage is 441.2 ft above North American Vertical Datum of 1988, from GPS survey. Satellite telemetry at station.
COOPERATION.--Funding for the operation of this station is provided by the U.S. Geological Survey.
REMARKS.--Flow slightly regulated by 6 flood-control reservoirs, which have a combined capacity of 440,200 acre-ft.
This station managed by the PAWSC Williamsport Field Office.

Available Parameters Available Period
  
2015-07-09  2024-04-20
2015-07-08  2024-04-20


 (7)
 

  -- or --


Summary of all available data for this site
Instantaneous-data availability statement


Discharge, cubic feet per second

Most recent instantaneous value: 23200 04-20-2024   08:45 EDT
Graph of  Discharge, cubic feet per second

Add up to 2 more sites and replot for "Discharge, cubic feet per second"

?


Create presentation-quality / stand-alone graph.   Subscribe to WaterAlert      

See this graph on the Monitoring Location Pages


Daily discharge, cubic feet per second -- statistics for Apr 20 based on 8 water years of record more
Min
(2023)
25th
percen-
tile
Median Mean Most Recent
Instantaneous
Value Apr 20
75th
percen-
tile
Max
(2019)
5980 8390 11600 16900 23200 26600 38200


Gage height, feet

Most recent instantaneous value: 12.64 04-20-2024   08:45 EDT
Graph of  Gage height, feet

Add up to 2 more sites and replot for "Gage height, feet"

?


Create presentation-quality / stand-alone graph.   Subscribe to WaterAlert      

See this graph on the Monitoring Location Pages