PROVISIONAL DATA SUBJECT TO REVISION
Click to hidestation-specific text
Funding for this site is provided by:
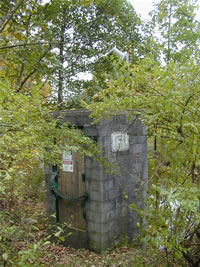 STATION.--01557500 BALD EAGLE CREEK AT TYRONE,
PA
STATION.--01557500 BALD EAGLE CREEK AT TYRONE,
PALOCATION.--Lat 40`41'01", long 78`14'02", Blair County, Hydrologic Unit 02050302, on left bank 0.2 mi upstream from highway bridge on SR 220 at Tyrone, 0.2 mi upstream from Laurel Run, and 1.3 mi upstream from mouth.
DRAINAGE AREA.--44.1 square miles.
PERIOD OF RECORD.--October 1944 to current year. Prior to October 1967, published as South Bald Eagle Creek at Tyrone.
GAGE.--Water-stage recorder and crest-stage gage. Datum of gage is 921.80 ft above National Geodetic Vertical Datum of 1929. Oct. 1, 1944 to Nov. 15, 1950, water-stage recorder, and Nov. 16, 1950 to Nov. 30, 1952, non-recording gage at site 0.5 mi downstream at datum 17.99 ft lower.
COOPERATION.--Station operated and maintained by the U.S. Geological Survey. Funding for the operation of this station is provided by the Pennsylvania Department of Environmental Protection and the U.S. Geological Survey.
REMARKS,--Prior to Nov. 30, 1952, daily discharges were affected by West Virginia Pulp and Paper Company diversion.
GAGE HEIGHTS OF IMPORTANCE.-
Supplied by USGS: Data transmitter operational limit - 15.8 ft;
Supplied by NWS: No flood stage has been determined for this station.
Summary of all available data for this site
Instantaneous-data availability statement

