USGS 01577500 Muddy Creek at Castle Fin, PA

PROVISIONAL DATA SUBJECT TO REVISION

Click to hidestation-specific text
Funding for this site is provided by:


Station gage imageSTATION.--01577500 MUDDY CREEK NEAR CASTLE FIN, PA
LOCATION.--Lat 39°46'21", long 76°18'58" referenced to North American Datum of 1927, York County, PA, Hydrologic Unit 02050306, bridge on SR 2024 (Paper Mill Rd), 0.8 mi northeast of Castle Fin, and approximately 1 mi east of the intersection of SR 2024 and State Highway 74.
DRAINAGE AREA.--133 square miles.
PERIOD OF RECORD.--October 1928 to September 1939 and April 1968 to September 1971. January 1989 to September 1995 and October 2010 to March 2014 (discharge measurements). April 2014 to current.
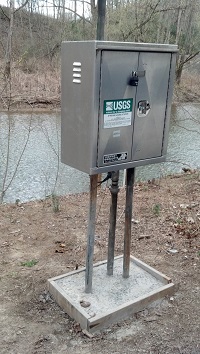
GAGE.--Water-stage recorder, crest-stage gage and water-quality monitor. Elevation of gage is 175.42 ft above National Geodetic Vertical Datum of 1929. Satellite telemetry at station.
COOPERATION.--Station established and maintained by the U.S. Geological Survey in cooperation with the U.S. Environmental Protection Agency, and the County of York.
GAGE HEIGHTS OF IMPORTANCE.--
Supplied by USGS.-- Operational limit of instrumentation - 18.5 ft.
This station managed by the PAWSC New Cumberland Office.

Available Parameters Available Period
  
2019-12-18  2024-04-18
2014-04-10  2024-04-18
2014-04-09  2024-04-18
2019-12-18  2024-04-18
2019-12-18  2024-04-18
2019-12-18  2024-04-18
2019-12-18  2024-04-18
2021-04-18  2024-04-18
2020-08-06  2024-04-18
2021-04-18  2024-04-18
2024-02-07  2024-04-18
2021-04-19  2024-04-18


 (7)
 

  -- or --


Summary of all available data for this site
Instantaneous-data availability statement


Temperature, water, degrees Celsius

Most recent instantaneous value: 14.2 04-18-2024   04:30 EDT
Graph of  Temperature, water, degrees Celsius

Add up to 2 more sites and replot for "Temperature, water, degrees Celsius"

?


Create presentation-quality / stand-alone graph.   Subscribe to WaterAlert      

See this graph on the Monitoring Location Pages


Discharge, cubic feet per second

Most recent instantaneous value: 271 04-18-2024   04:30 EDT
Graph of  Discharge, cubic feet per second

Add up to 2 more sites and replot for "Discharge, cubic feet per second"

?


Create presentation-quality / stand-alone graph.   Subscribe to WaterAlert      

See this graph on the Monitoring Location Pages


Daily discharge, cubic feet per second -- statistics for Apr 18 based on 24 water years of record more
Min
(1931)
25th
percen-
tile
Median Mean Most Recent
Instantaneous
Value Apr 18
75th
percen-
tile
Max
(1933)
69.0 127 193 231 271 283 574


Gage height, feet

Most recent instantaneous value: 3.94 04-18-2024   04:30 EDT
Graph of  Gage height, feet

Add up to 2 more sites and replot for "Gage height, feet"

?


Create presentation-quality / stand-alone graph.   Subscribe to WaterAlert      

See this graph on the Monitoring Location Pages