USGS 09124500 LAKE FORK AT GATEVIEW, CO.

PROVISIONAL DATA SUBJECT TO REVISION

Click to hidestation-specific text
Click for larger image

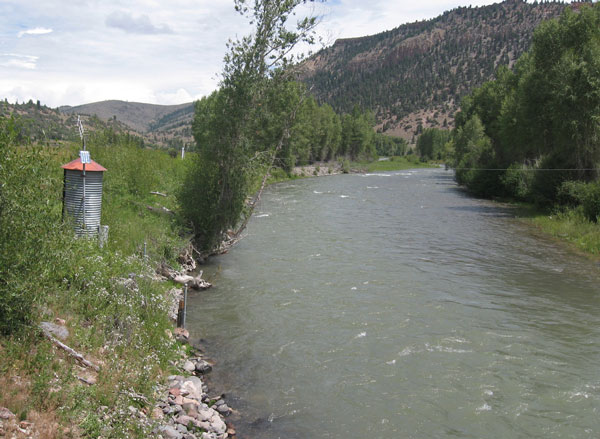
One or more sensors at this site are operated seasonally.

Station operated by the U.S. Geological Survey, Colorado Water Science Center, as part of the USGS National Streamflow Information Program (NSIP).

Current shift adjusted rating table.
What is a shift adjusted stage-discharge rating table?

Boating safety tips

This station managed by the Grand Junction Field Office.

Available Parameters Available Period
  
2018-08-13  2025-07-12
2019-05-08  2025-07-12
1986-10-01  2025-07-12
2020-10-06  2025-07-12
2022-05-01  2025-07-12
2025-01-16  2025-07-12


 (7)
 

  -- or --


Summary of all available data for this site
Instantaneous-data availability statement


Temperature, water, degrees Celsius

Most recent instantaneous value: 18.4 07-12-2025   16:15 MDT
Graph of  Temperature, water, degrees Celsius

Add up to 2 more sites and replot for "Temperature, water, degrees Celsius"

?


Create presentation-quality / stand-alone graph.   Subscribe to WaterAlert      

See this graph on the Monitoring Location Pages


Discharge, cubic feet per second

Most recent instantaneous value: 272 07-12-2025   16:15 MDT
Graph of  Discharge, cubic feet per second

Add up to 2 more sites and replot for "Discharge, cubic feet per second"

?


Create presentation-quality / stand-alone graph.   Subscribe to WaterAlert      

See this graph on the Monitoring Location Pages


Daily discharge, cubic feet per second -- statistics for Jul 12 based on 87 water years of record more
Min
(2002)
25th
percen-
tile
Most Recent
Instantaneous
Value Jul 12
Median Mean 75th
percen-
tile
Max
(1995)
66.1 243 272 395 492 642 1630


Specific conductance, water, unfiltered, microsiemens per centimeter at 25 degrees Celsius

Most recent instantaneous value: 162 07-12-2025   16:15 MDT
Graph of  Specific conductance, water, unfiltered, microsiemens per centimeter at 25 degrees Celsius

Add up to 2 more sites and replot for "Specific conductance, water, unfiltered, microsiemens per centimeter at 25 degrees Celsius"

?


Create presentation-quality / stand-alone graph.   Subscribe to WaterAlert      

See this graph on the Monitoring Location Pages