USGS 02325000 FENHOLLOWAY RIVER NEAR PERRY, FLA

PROVISIONAL DATA SUBJECT TO REVISION

Click to hidestation-specific text

This gage is monitored in cooperation with the Florida Department of Environmental Protection.
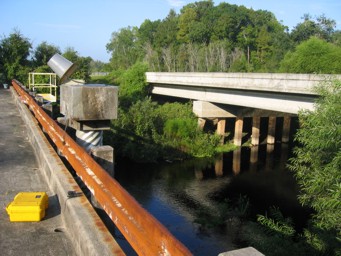
Link to the Florida Department of Environmental Protection.

Gage structure-August 28, 2007. Link to the Department of Environmental Protection.

August 28, 2007. Link to the Department of Environmental Protection.

Available Parameters Available Period
  
1986-05-01  2025-07-02
2007-10-01  2025-07-02


 (7)
 

  -- or --


Summary of all available data for this site
Instantaneous-data availability statement


Discharge, cubic feet per second

Most recent instantaneous value: 116 07-02-2025   10:45 EDT
Graph of  Discharge, cubic feet per second

Add up to 2 more sites and replot for "Discharge, cubic feet per second"

?


Create presentation-quality / stand-alone graph.   Subscribe to WaterAlert      

See this graph on the Monitoring Location Pages


Daily discharge, cubic feet per second -- statistics for Jul 2 based on 46 water years of record more
Min
(2022)
25th
percen-
tile
Most Recent
Instantaneous
Value Jul 2
Median Mean 75th
percen-
tile
Max
(1983)
54.8 102 116 128 172 175 640


Gage height, feet

Most recent instantaneous value: 13.54 07-02-2025   10:45 EDT
Graph of  Gage height, feet

Add up to 2 more sites and replot for "Gage height, feet"

?


Create presentation-quality / stand-alone graph.   Subscribe to WaterAlert      

See this graph on the Monitoring Location Pages