PROVISIONAL DATA SUBJECT TO REVISION
Click to hidestation-specific text
 LOCATION.--Lat
39°30'55.9", long 76°22'07.8", Harford County, MD,
Hydrologic Unit 02060003, on left bank at upstream side of highway
bridge on
LOCATION.--Lat
39°30'55.9", long 76°22'07.8", Harford County, MD,
Hydrologic Unit 02060003, on left bank at upstream side of highway
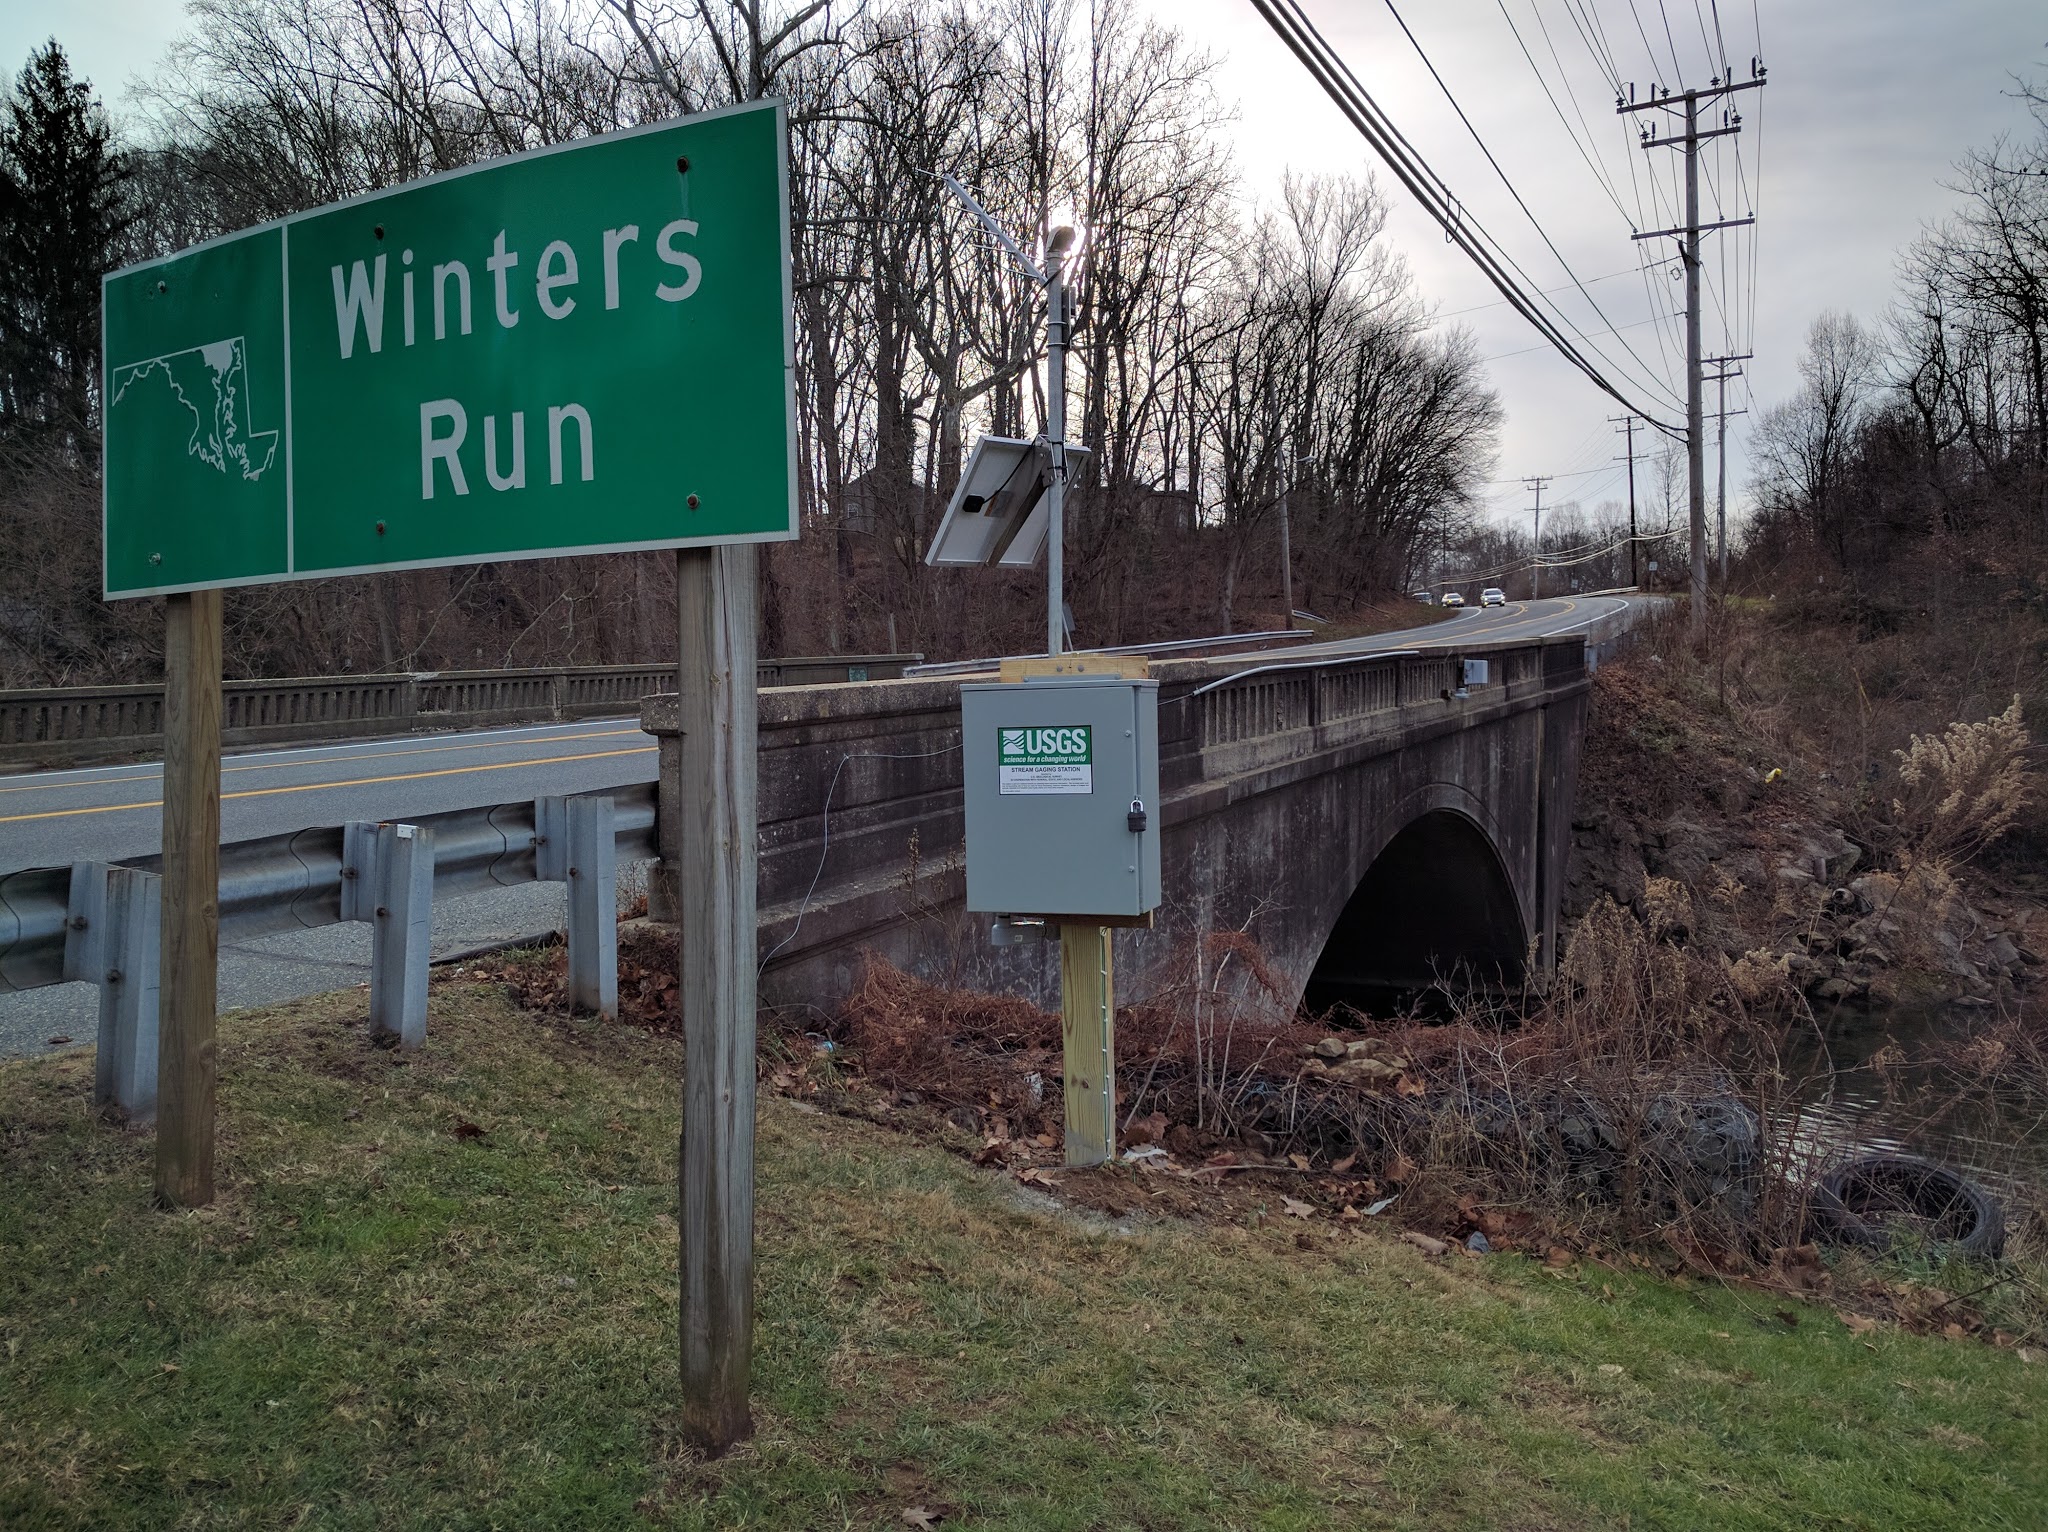
bridge onBel Air Road (US-1 Business), 0.9 mi downstream from Heavenly Waters, 1.8 mi southwest of Bel Air, and 9.5 mi upstream from mouth.
DRAINAGE AREA.--36.8 mi2.
PERIOD OF RECORD.--July 1954 to July 1966 (occasional low-flow measurements), April 1988 to September 2015 (operated as a low-flow station
only). Annual maximum, water year 2006. October 2015 to current year. Prior to April 12, 2021, published as WINTERS RUN HD OF OTTER PT CREEK NEAR BEL AIR, MD.
GAGE.--Water-stage recorder and crest-stage gage. Datum of gage is 179.57 ft above North American Vertical Datum of 1988.
REMARKS.--U.S. Geological Survey satellite data-collection platform at station.
EXTREMES FOR PERIOD OF RECORD.--Maximum discharge, 5,740 ft³/s, Feb. 24, 2016, gage height, 9.59 ft; minimum discharge, 1.15 ft³/s, Sept. 30, 2019,
as a result of regulation from water plant at station.
EXTREMES OUTSIDE PERIOD OF RECORD.--Flood of June 27, 2006 reached a stage of 11.35 ft, from floodmarks and strip chart record, discharge, 7,240 ft³/s.
COOPERATION.--Funding for the operation of this station is provided by the Maryland Department of the Environment.
| Boating safety tips |
Summary of all available data for this site
Instantaneous-data availability statement

