PROVISIONAL DATA SUBJECT TO REVISION
Click to hidestation-specific text
|
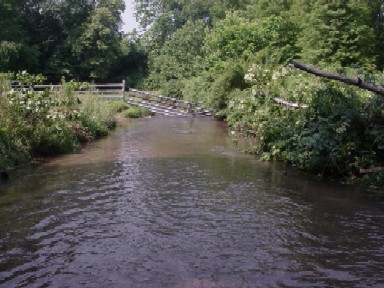 |
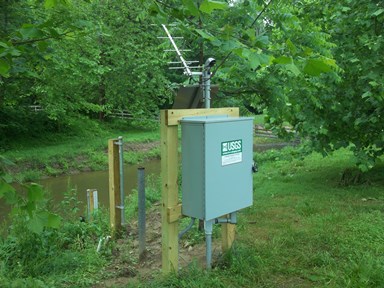
LOCATION.--Lat 39°31'14.2", long 76°46'00.8", Baltimore County, MD, Hydrologic Unit 02060003, on right bank
   400 ft downstream from bridge on Maryland Route 128, 0.7 mi upstream from mouth, and 2.4 mi southwest of
   Butler.
DRAINAGE AREA.--12.3 mi2.
PERIOD OF RECORD.--May 1982 to February 1988. October 1996 to current year.
REVISIONS HISTORY.--WDR MD-DE-87-1: 1984-86(P).
GAGE.--Water-stage recorder and crest-stage gage. Datum of gage is 375.16 ft above North American Vertical
   Datum of 1988.
REMARKS.--U.S. Geological Survey satellite data-collection platform at station.
EXTREMES FOR PERIOD OF RECORD.--Maximum discharge, 3,220 ft3/s, Sept. 8, 1987, gage height, 8.28 ft,
   Maximum gage height, 10.86 ft, July 23, 2018; minimum discharge, 0.72 ft3/s, Aug. 22, 23, 2002.
COOPERATION.--Funding for the operation of this station is provided by the Baltimore County Department of
   Environmental Protection & Sustainability, and the U.S. Geological Survey.
| Boating safety tips |
Summary of all available data for this site
Instantaneous-data availability statement