USGS 01585075 FOSTER BRANCH NEAR JOPPATOWNE, MD

PROVISIONAL DATA SUBJECT TO REVISION

Click to hidestation-specific text
Click for larger image
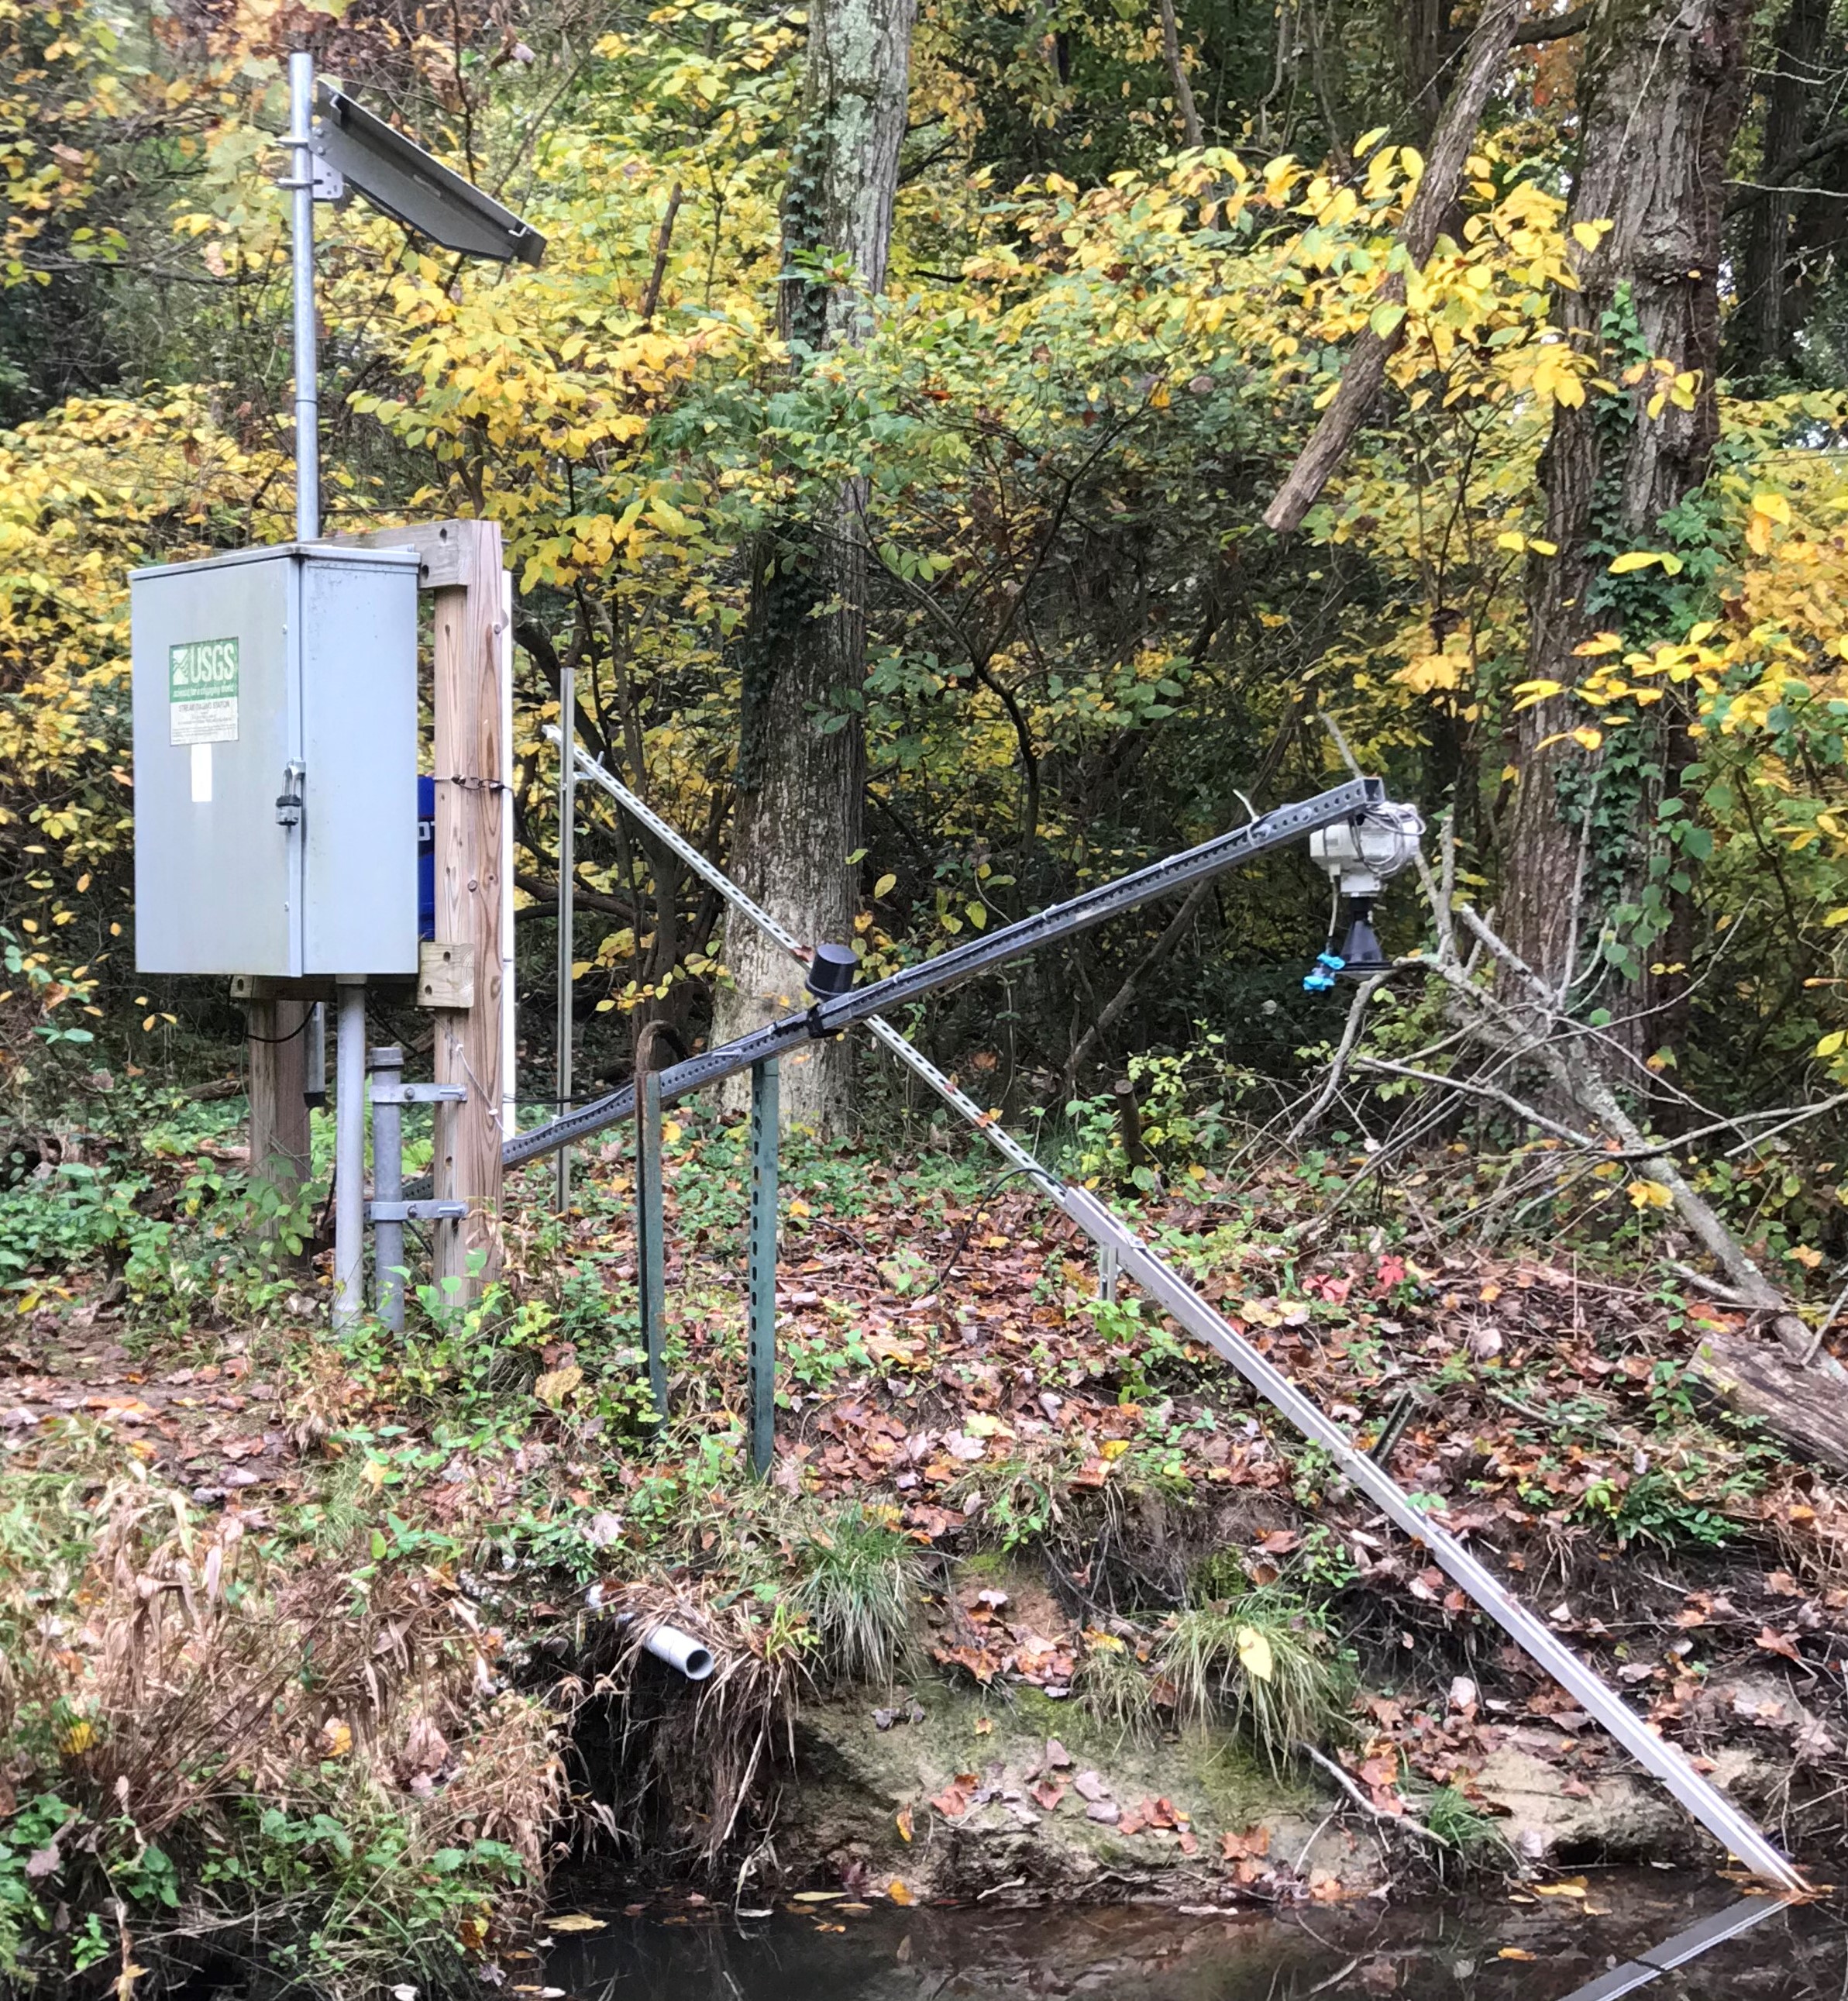
LOCATION.--Lat 39°24'30.7", long 76°20'33.5", Harford County, MD,
 Hydrologic Unit 02060003, on left bank, 0.10 mi downstream from highway bridge at Trimble Road and
 0.95 mi upstream from mouth.
DRAINAGE AREA.--1.83 mi2, from automated delineation using 30-meter National Elevation Dataset,
 digital elevation model data, dated December 2011.
PERIOD OF RECORD.--September 2015 to current year.
REVISIONS HISTORY.--https://waterdata.usgs.gov/nwis/dv/?site_no=01585075: 2015-2017; 2015-2019.
GAGE.--Water-stage recorder and crest stage gage. Datum of gage is 0.53 ft above North American
 Vertical Datum of 1988. 
REMARKS.--U.S. Geological Survey water-data telemeter at station.
EXTREMES FOR PERIOD OF RECORD.--Maximum discharge, 726 ft3/s, Aug. 7, 2020, gage height, 5.49 ft;
 minimum discharge, 0.01 ft3/s, Aug. 14, 2016, July 14, 21, 22, Sept. 20-30, Oct. 1-9, 2017, July 4, 5,
 16, 17, 19-21, Sept. 20-22, 2020.
COOPERATION.--Funding for the operation of this station is provided by the Harford County
 Department of Public Works, and the U.S. Geological Survey.

Boating safety tips
This station managed by the MD-DE-DC Water Science Center Baltimore office.

Available Parameters Available Period
  
2015-10-01  2024-03-28
2015-09-29  2024-03-28
2015-09-29  2024-03-28
2015-09-30  2024-03-28
2015-10-01  2016-02-21
2019-11-15  2024-03-28
2016-02-23  2020-03-17


 (7)
 

  -- or --


Summary of all available data for this site
Instantaneous-data availability statement


Temperature, water, degrees Celsius

Most recent instantaneous value: 9.0 03-28-2024   12:05 EDT
Graph of  Temperature, water, degrees Celsius

Add up to 2 more sites and replot for "Temperature, water, degrees Celsius"

?


Create presentation-quality / stand-alone graph.   Subscribe to WaterAlert      

See this graph on the Monitoring Location Pages


Specific conductance, water, unfiltered, microsiemens per centimeter at 25 degrees Celsius

Most recent instantaneous value: 166 03-28-2024   12:05 EDT
Graph of  Specific conductance, water, unfiltered, microsiemens per centimeter at 25 degrees Celsius

Add up to 2 more sites and replot for "Specific conductance, water, unfiltered, microsiemens per centimeter at 25 degrees Celsius"

?


Create presentation-quality / stand-alone graph.   Subscribe to WaterAlert      

See this graph on the Monitoring Location Pages


Turbidity, water, unfiltered, monochrome near infra-red LED light, 780-900 nm, detection angle 90 +-2.5 degrees, formazin nephelometric units (FNU)

Most recent instantaneous value: 33.5 03-28-2024   12:05 EDT
Graph of  Turbidity, water, unfiltered, monochrome near infra-red LED light, 780-900 nm, detection angle 90 +-2.5 degrees, formazin nephelometric units (FNU)

Add up to 2 more sites and replot for "Turbidity, water, unfiltered, monochrome near infra-red LED light, 780-900 nm, detection angle 90 +-2.5 degrees, formazin nephelometric units (FNU)"

?


Create presentation-quality / stand-alone graph.   Subscribe to WaterAlert      

See this graph on the Monitoring Location Pages


Turbidity, water, unfiltered, monochrome near infra-red LED light, 780-900 nm, detection angle 90 +-2.5 degrees, formazin nephelometric units (FNU), TS032, [Discontinued]
 
-- Data temporarily unavailable for the time period specified --

Turbidity, water, unfiltered, monochrome near infra-red LED light, 780-900 nm, detection angle 90 +-2.5 degrees, formazin nephelometric units (FNU), TS087, [Discontinued]
 
-- Data temporarily unavailable for the time period specified --