PROVISIONAL DATA SUBJECT TO REVISION
Click to hidestation-specific text
|
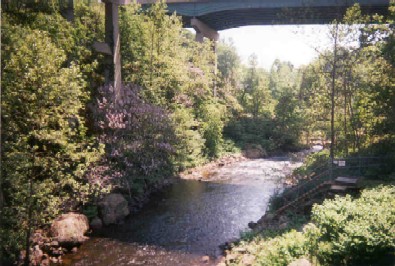 |
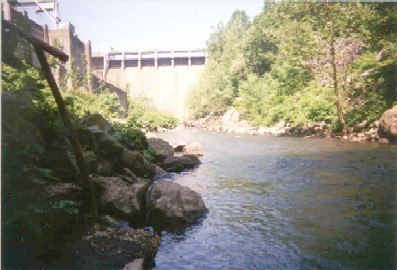
LOCATION.--Lat 39°06'56.6", long 76°52'25.5", Prince George's County, MD, Hydrologic Unit 02060006,
   on right bank, 0.7 mi upstream from Walker Branch, 1.3 mi northwest of Laurel, and 81 mi upstream from mouth.
DRAINAGE AREA.--132 mi2.
PERIOD OF RECORD.--October 1944 to current year.
REVISIONS HISTORY.--WDR MD-DE-78-1: 1976(M). WDR MD-DE-89-1: 1978(M), 1979(M).
GAGE.--Water-stage recorder and crest-stage gage. Datum of gage is 152.79 ft above North American Vertical Datum of 1988.
   Prior to Oct. 1, 1955, water-stage recorder and concrete control at site 0.3 mi downstream at different gage datum.
   Oct. 1, 1955 to Sept. 30, 1956, nonrecording gage at present site at gage datum 1.2 ft lower. Oct. 1, 1956 to
   Jan. 27, 1957, nonrecording gage at present site and gage datum. Jan. 28, 1957 to May 3, 1972, water-stage recorder
   and concrete control at present site and gage datum. May 4, 1972 to Sept. 4, 1973, nonrecording gage at present
   site and gage datum.
REMARKS.--Records do not include diversion at Patuxent (formerly Willis School) filtration plant for
   supply of Washington Suburban Sanitary District. Flow regulated by Triadelphia Reservoir, and since
   March 1954 by T. Howard Duckett Reservoir, combined usable capacity, 11,800,000,000 gal; dead storage,
   80,000,000 gal. U.S. Geological Survey gage-height telemeter at station.
EXTREMES FOR PERIOD OF RECORD.--Maximum discharge, 26,000 ft3/s, June 22, 1972, gage height, 25.00 ft;
   minimum discharge, 0.05 ft3/s, July 18, 1985 (valve closed for repairs).
COOPERATION.--Funding for the operation of this station is provided by the Washington Suburban Sanitary
   Commission.
| Boating safety tips |
Summary of all available data for this site
Instantaneous-data availability statement

