PROVISIONAL DATA SUBJECT TO REVISION

Operated in cooperation with the Minnehaha Creek Watershed District with USGS matching funds. |
For paddling the creek, the Minnehaha Creek Watershed District suggests a streamflow (also known as discharge) rate between 75-150 cubic feet per second, depending on experience. More information is available from the MCWD web page here or at the link above.
USGS WaterWatch's "Site Dashboard" provides seasonal and other context-oriented information about current and historical streamflow.
Precipitation data are temporary and will only be displayed for 120 days. Retrievals of older data will not be available. Although rainfall instrumentation is calibrated least annually, the temporary classification means that documented routine inspections and other quality assurance measures may not be performed that would make the data suitable for archival, retrieval, or future use in general scientific or interpretive studies.
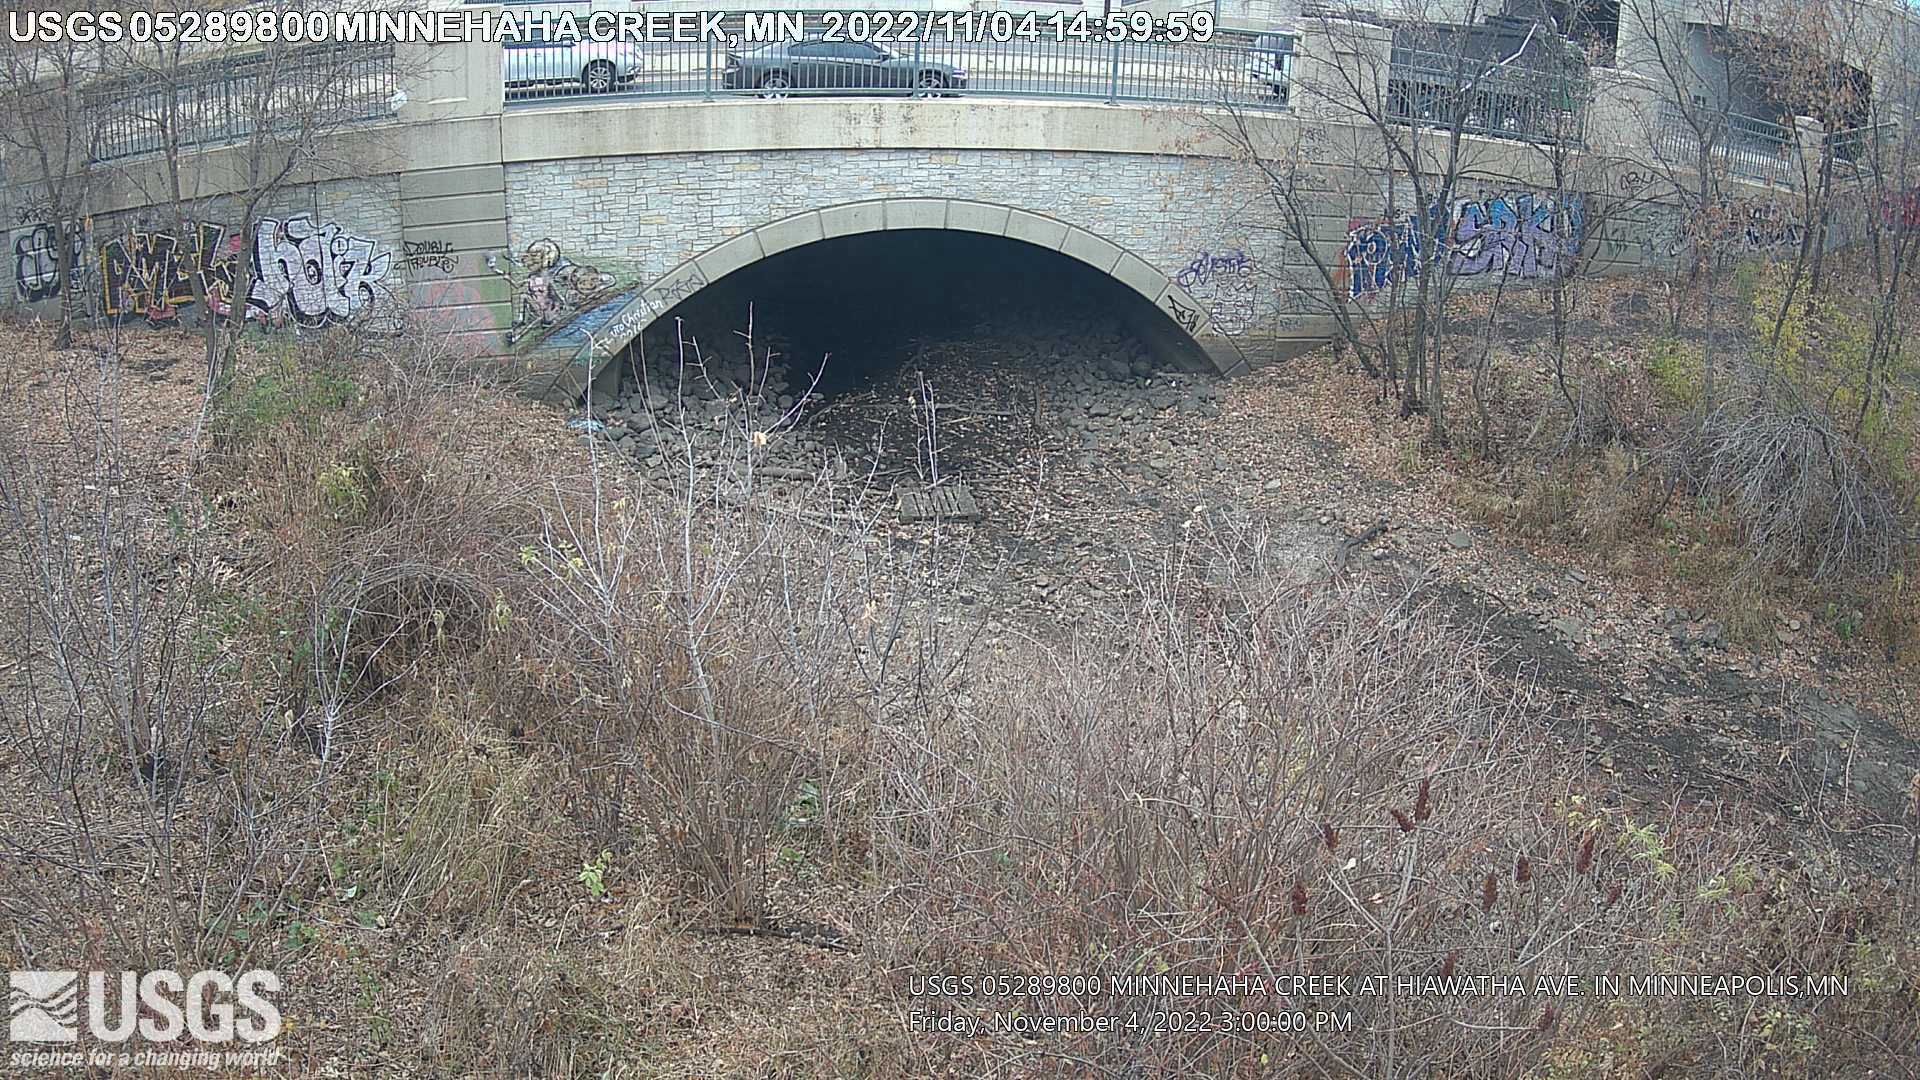
Click on the static or time-lapse images below to download or view larger versions from the Storm Summary Time Lapse web page.
 |
Time-lapse videos are considered proof of concept with no guarantee of up time. Videos can be viewed using Chrome, Firefox or Opera browser applications on smartphone, tablet, and computer devices. Additional browser support for Safari and Internet Explorer may be added later.
Any use of trade, firm, or product names is for descriptive purposes only and does not imply endorsement by the U.S. Government.
Summary of all available data for this site
Instantaneous-data availability statement
|
|
||||
|---|---|---|---|---|
| Zoom period plot | ||||
| y axis labels |
|
|||
| Period selected plot | ||||
|
||||
![]() U.S. Department of the Interior |
U.S. Geological Survey
U.S. Department of the Interior |
U.S. Geological Survey
Title: USGS Current Conditions for Minnesota
URL:
Page Contact Information: Minnesota Water Data Support Team
Page Last Modified: 2025-07-08 23:14:02 EDT
1.93 1.37 nadww01