USGS 06768000 Platte River near Overton, Nebr.

PROVISIONAL DATA SUBJECT TO REVISION

Click to hidestation-specific text
> WaterNow – get the latest gage data from your mobile phone or email.

> Rating Information

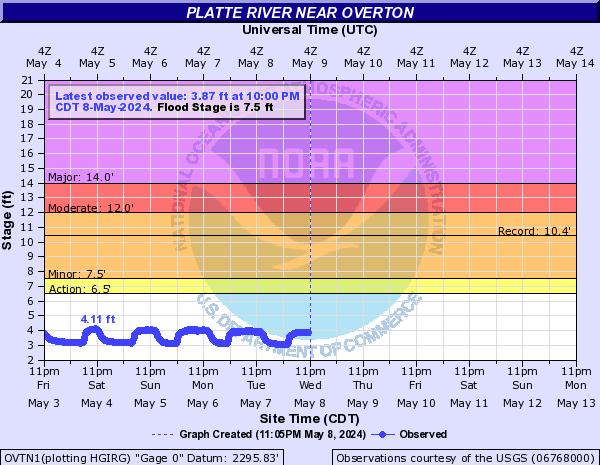
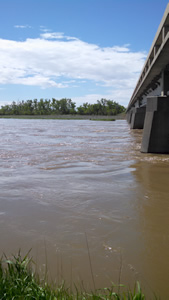
Channel view near USGS
gaging station: Platte River
near Overton, Nebr.

  Platte River Basin
(confluence-Loup River)
Downstream

This station managed by the North Platte Field Office.

Available Parameters Available Period
  
2011-10-01  2024-04-25
2023-12-27  2024-04-25
1998-01-14  2024-04-25
2007-10-01  2024-04-25


 (7)
 

  -- or --


Summary of all available data for this site
Instantaneous-data availability statement


Temperature, water, degrees Celsius

Most recent instantaneous value: 11.6 04-25-2024   06:45 CDT
Graph of  Temperature, water, degrees Celsius

Add up to 2 more sites and replot for "Temperature, water, degrees Celsius"

?


Create presentation-quality / stand-alone graph.   Subscribe to WaterAlert      

See this graph on the Monitoring Location Pages


Temperature, air, degrees Celsius

Most recent instantaneous value: 12.5 04-25-2024   06:45 CDT
Graph of  Temperature, air, degrees Celsius

Add up to 2 more sites and replot for "Temperature, air, degrees Celsius"

?


Create presentation-quality / stand-alone graph.   Subscribe to WaterAlert      

See this graph on the Monitoring Location Pages


Discharge, cubic feet per second, [Discharge from Primary Sensor]

Most recent instantaneous value: 237 04-25-2024   07:00 CDT
Graph of  Discharge, cubic feet per second, [Discharge from Primary Sensor]

Add up to 2 more sites and replot for "Discharge, cubic feet per second, [Discharge from Primary Sensor]"

?


Create presentation-quality / stand-alone graph.   Subscribe to WaterAlert      

See this graph on the Monitoring Location Pages


Daily discharge, cubic feet per second -- statistics for Apr 25 based on 82 water years of record more
Min
(2006)
Most Recent
Instantaneous
Value Apr 25
25th
percen-
tile
Median Mean 75th
percen-
tile
Max
(1984)
150 237 737 1350 1720 2090 11300


Gage height, feet, [Primary Stage Sensor]

Most recent instantaneous value: 2.55 04-25-2024   07:00 CDT
Graph of  Gage height, feet, [Primary Stage Sensor]

Add up to 2 more sites and replot for "Gage height, feet, [Primary Stage Sensor]"

?


Create presentation-quality / stand-alone graph.   Subscribe to WaterAlert      

See this graph on the Monitoring Location Pages