USGS 06775900 Dismal River near Thedford, Nebr.

PROVISIONAL DATA SUBJECT TO REVISION

Click to hidestation-specific text

Datum of gage was lowered 2.0 feet effective July 8, 2020 due to continued degradation (scour) of the channel at this streamgage. Previous datum at this gage was 2,800.18 ft above NAVD88, and is now 2,798.18 ft above NAVD88. Please contact Jason Lambrecht (jmlambre@usgs.gov, 402-328-4124) or John Miller (jdmiller@usgs.gov, 308-532-5323) at the USGS Nebraska Water Science Center with any questions.

Funding for this site is provided by
logo
National Streamflow
Information Program
> WaterNow – get the latest gage data from your mobile phone or email.

> Rating Information

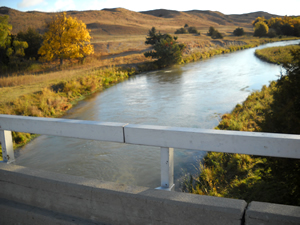
Downstream view from USGS gaging station: Dismal River near Thedford, Nebr.

Upstream Loup River Basin Downstream

This station managed by the North Platte Field Office.

Available Parameters Available Period
  
2012-03-09  2024-04-19
1990-11-15  2024-04-19
2007-10-01  2024-04-19
2023-12-21  2024-04-19


 (7)
 

  -- or --


Summary of all available data for this site
Instantaneous-data availability statement


Temperature, water, degrees Celsius

Most recent instantaneous value: 10.0 04-19-2024   04:45 CDT
Graph of  Temperature, water, degrees Celsius

Add up to 2 more sites and replot for "Temperature, water, degrees Celsius"

?


Create presentation-quality / stand-alone graph.   Subscribe to WaterAlert      

See this graph on the Monitoring Location Pages


Discharge, cubic feet per second

Most recent instantaneous value: 283 04-19-2024   04:45 CDT
Graph of  Discharge, cubic feet per second

Add up to 2 more sites and replot for "Discharge, cubic feet per second"

?


Create presentation-quality / stand-alone graph.   Subscribe to WaterAlert      

See this graph on the Monitoring Location Pages


Daily discharge, cubic feet per second -- statistics for Apr 19 based on 53 water years of record more
Min
(1986)
25th
percen-
tile
Median Mean 75th
percen-
tile
Most Recent
Instantaneous
Value Apr 19
Max
(2016)
184 202 221 223 238 283 293


Gage height, feet

Most recent instantaneous value: 2.00 04-19-2024   04:45 CDT
Graph of  Gage height, feet

Add up to 2 more sites and replot for "Gage height, feet"

?


Create presentation-quality / stand-alone graph.   Subscribe to WaterAlert      

See this graph on the Monitoring Location Pages


Stream water level elevation above NAVD 1988, in feet

Most recent instantaneous value: 2802.18 04-19-2024   04:45 CDT
Graph of  Stream water level elevation above NAVD 1988, in feet

Add up to 2 more sites and replot for "Stream water level elevation above NAVD 1988, in feet"

?


Create presentation-quality / stand-alone graph.   Subscribe to WaterAlert      

See this graph on the Monitoring Location Pages