PROVISIONAL DATA SUBJECT TO REVISION
Click to hidestation-specific text
Funding for this site is provided by:
 STATION.--01432110 LACKAWAXEN RIVER AT ROWLAND,
PA
STATION.--01432110 LACKAWAXEN RIVER AT ROWLAND,
PALOCATION.--Lat 41`28'33", long 75`02'12", Pike County, Hydrologic Unit 02040104, on concrete highway bridge on SR 1003, at river mile 4.02, 0.5 mi east of Rowland.
DRAINAGE AREA.--589 square miles.
PERIOD OF RECORD.--Water year 1949 (low-flow partial-record station), water years 1989 to 2007 (miscellaneous measurements), July 2007 to current year.
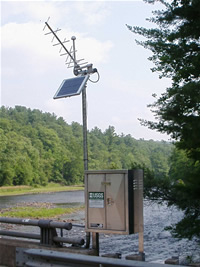
GAGE.--Water-stage recorder, crest-stage gage, and water-quality monitor. Datum of gage is 668.83 ft above North American Vertical Datum of 1988. Prior to October 1988, gage located at lat 41°28'19", long 75°02'25", 0.3 mi upstream at different datum. Satellite telemetry at station.
COOPERATION.--Station established and maintained by the U.S. Geological Survey in cooperation with the Pennsylvania Department of Environmental Protection and Brookfield Renewable.
REMARKS.--Regulation since 1960 by Prompton Reservoir (station 01428900) 14.9 mi upstream, and at high flow since 1959 by General Edgar Jadwin Reservoir (station 01429400) 13 mi upstream, and since 1929 from Wallenpaupack Lake (station 01431700) 8 mi upstream. The levels of the Lackawaxen River below the plant are subject to rapid elevation changes from the hydroelectic plant. When operating at full capacity, generators at the plant can discharge 46 million gallons (1,708 cubic feet per second) of water each hour into the Lackawaxen River.
GAGE HEIGHTS OF IMPORTANCE.-
Supplied by USGS: Data transmitter operational limit - 24.4 ft;
Supplied by NWS: No flood stage has been determined for this station.
Instantaneous-data availability statement
