LOCATION.--Lat 41°28'31", long
74°54'46" referenced to North American Datum of 1927,
Pike County, PA, Hydrologic Unit 02040104, at
Shohola-Barryville Bridge at Barryville, just upstream from
Halfway Brook, and 1,000 ft upstream from Shohola Creek.
DRAINAGE AREA.--2,659 mi².
PERIOD OF RECORD.--October 2018 to March 2024. April
2024 to September 2024 (gage height only). October 2024 to
current year.
GAGE.--Water-stage recorder. Datum of gage is 559.78 ft
above NGVD of 1929 and 559.31 ft above NAVD of 1988.
REMARKS.--Flow regulated by Prompton Reservoir (station
01428900), General Edgar Jadwin Reservoir (station 01429400),
and Lake Wallenpaupack (station 01431700). Large diurnal
fluctuations at medium and low flows caused by powerplants on
tributary streams. Subsequent to September 1954, entire flow
from 371 mi² of drainage area controlled by Pepacton Reservoir
(station 01416900), and subsequent to October 1963, entire flow
from 454 mi² of drainage area controlled by Cannonsville
Reservoir (station 01424997). Part of flow from these
reservoirs diverted for New York City municipal supply.
Remainder of flow (except for conservation releases and spill)
impounded for release during periods of low flow in the lower
Delaware River basin, as directed by the Delaware River
Master.
Water Year 2019: Records fair except those for estimated daily
discharges, which are poor. Water Years 2020-24: Records good
except those for estimated daily discharges, which are
poor.
EXTREMES FOR PERIOD OF RECORD.--Maximum discharge,
88,400 ft³/s, Oct. 27, 2021, gage height, 18.69 ft; minimum
discharge, 721 ft³/s, gage height, 3.35 ft, Oct. 14, 2019;
minimum gage height, 3.35 ft, Oct. 14, 2019, Oct. 13,
2020.
EXTREMES OUTSIDE PERIOD OF RECORD.--Flood of June 28,
2006, reached a stage of 28.92 ft, from floodmark in gage
house.
PERIOD OF DAILY RECORD1.--WATER TEMPERATURE:
October 1967 to September 1973, March 1975 to current year.
SPECIFIC CONDUCTANCE: August 2019 to March 2024.
INSTRUMENTATION1.--Water-temperature and
specific conductance satellite telemeter provides
15-minute-interval readings. From March 1975 to February 1994,
water-temperature recorder provided one-hour-interval readings.
Prior to September 1973, water-temperature recorder provided
continuous recordings.
REMARKS1.--Temperature readings prior to Oct.
1, 2007, rounded to the nearest 0.5 °C. Unpublished records of
daily temperatures for May to September 1964-66 are available
in files of the Geological Survey.
EXTREMES FOR PERIOD OF DAILY RECORD1.--WATER
TEMPERATURE: Prior to Oct. 1, 2007--Maximum (water years
1968-73, 1976-78, 1980-82, 1986-88, 1990-2002, 2004-07), 32.0
°C, July 20, 21, 1980; minimum, 0.0 °C on many days during
winter periods. WATER TEMPERATURE: After Oct. 1, 2007--Maximum,
29.8 °C, July 7, 2010; minimum, -0.2 °C on several days during
2021 winter period. SPECIFIC CONDUCTANCE: Maximum, 227
uS/cm at 25 °C, Jan. 7, 8, 9, 2021; minimum, 30 uS/cm
at 25 °C, June 15, 17, 2020.
1 Water-Quality Records
 Site Information
 WaterAlert – get an
email or text (SMS) alert based on your chosen threshold.
WaterAlert – get an
email or text (SMS) alert based on your chosen threshold.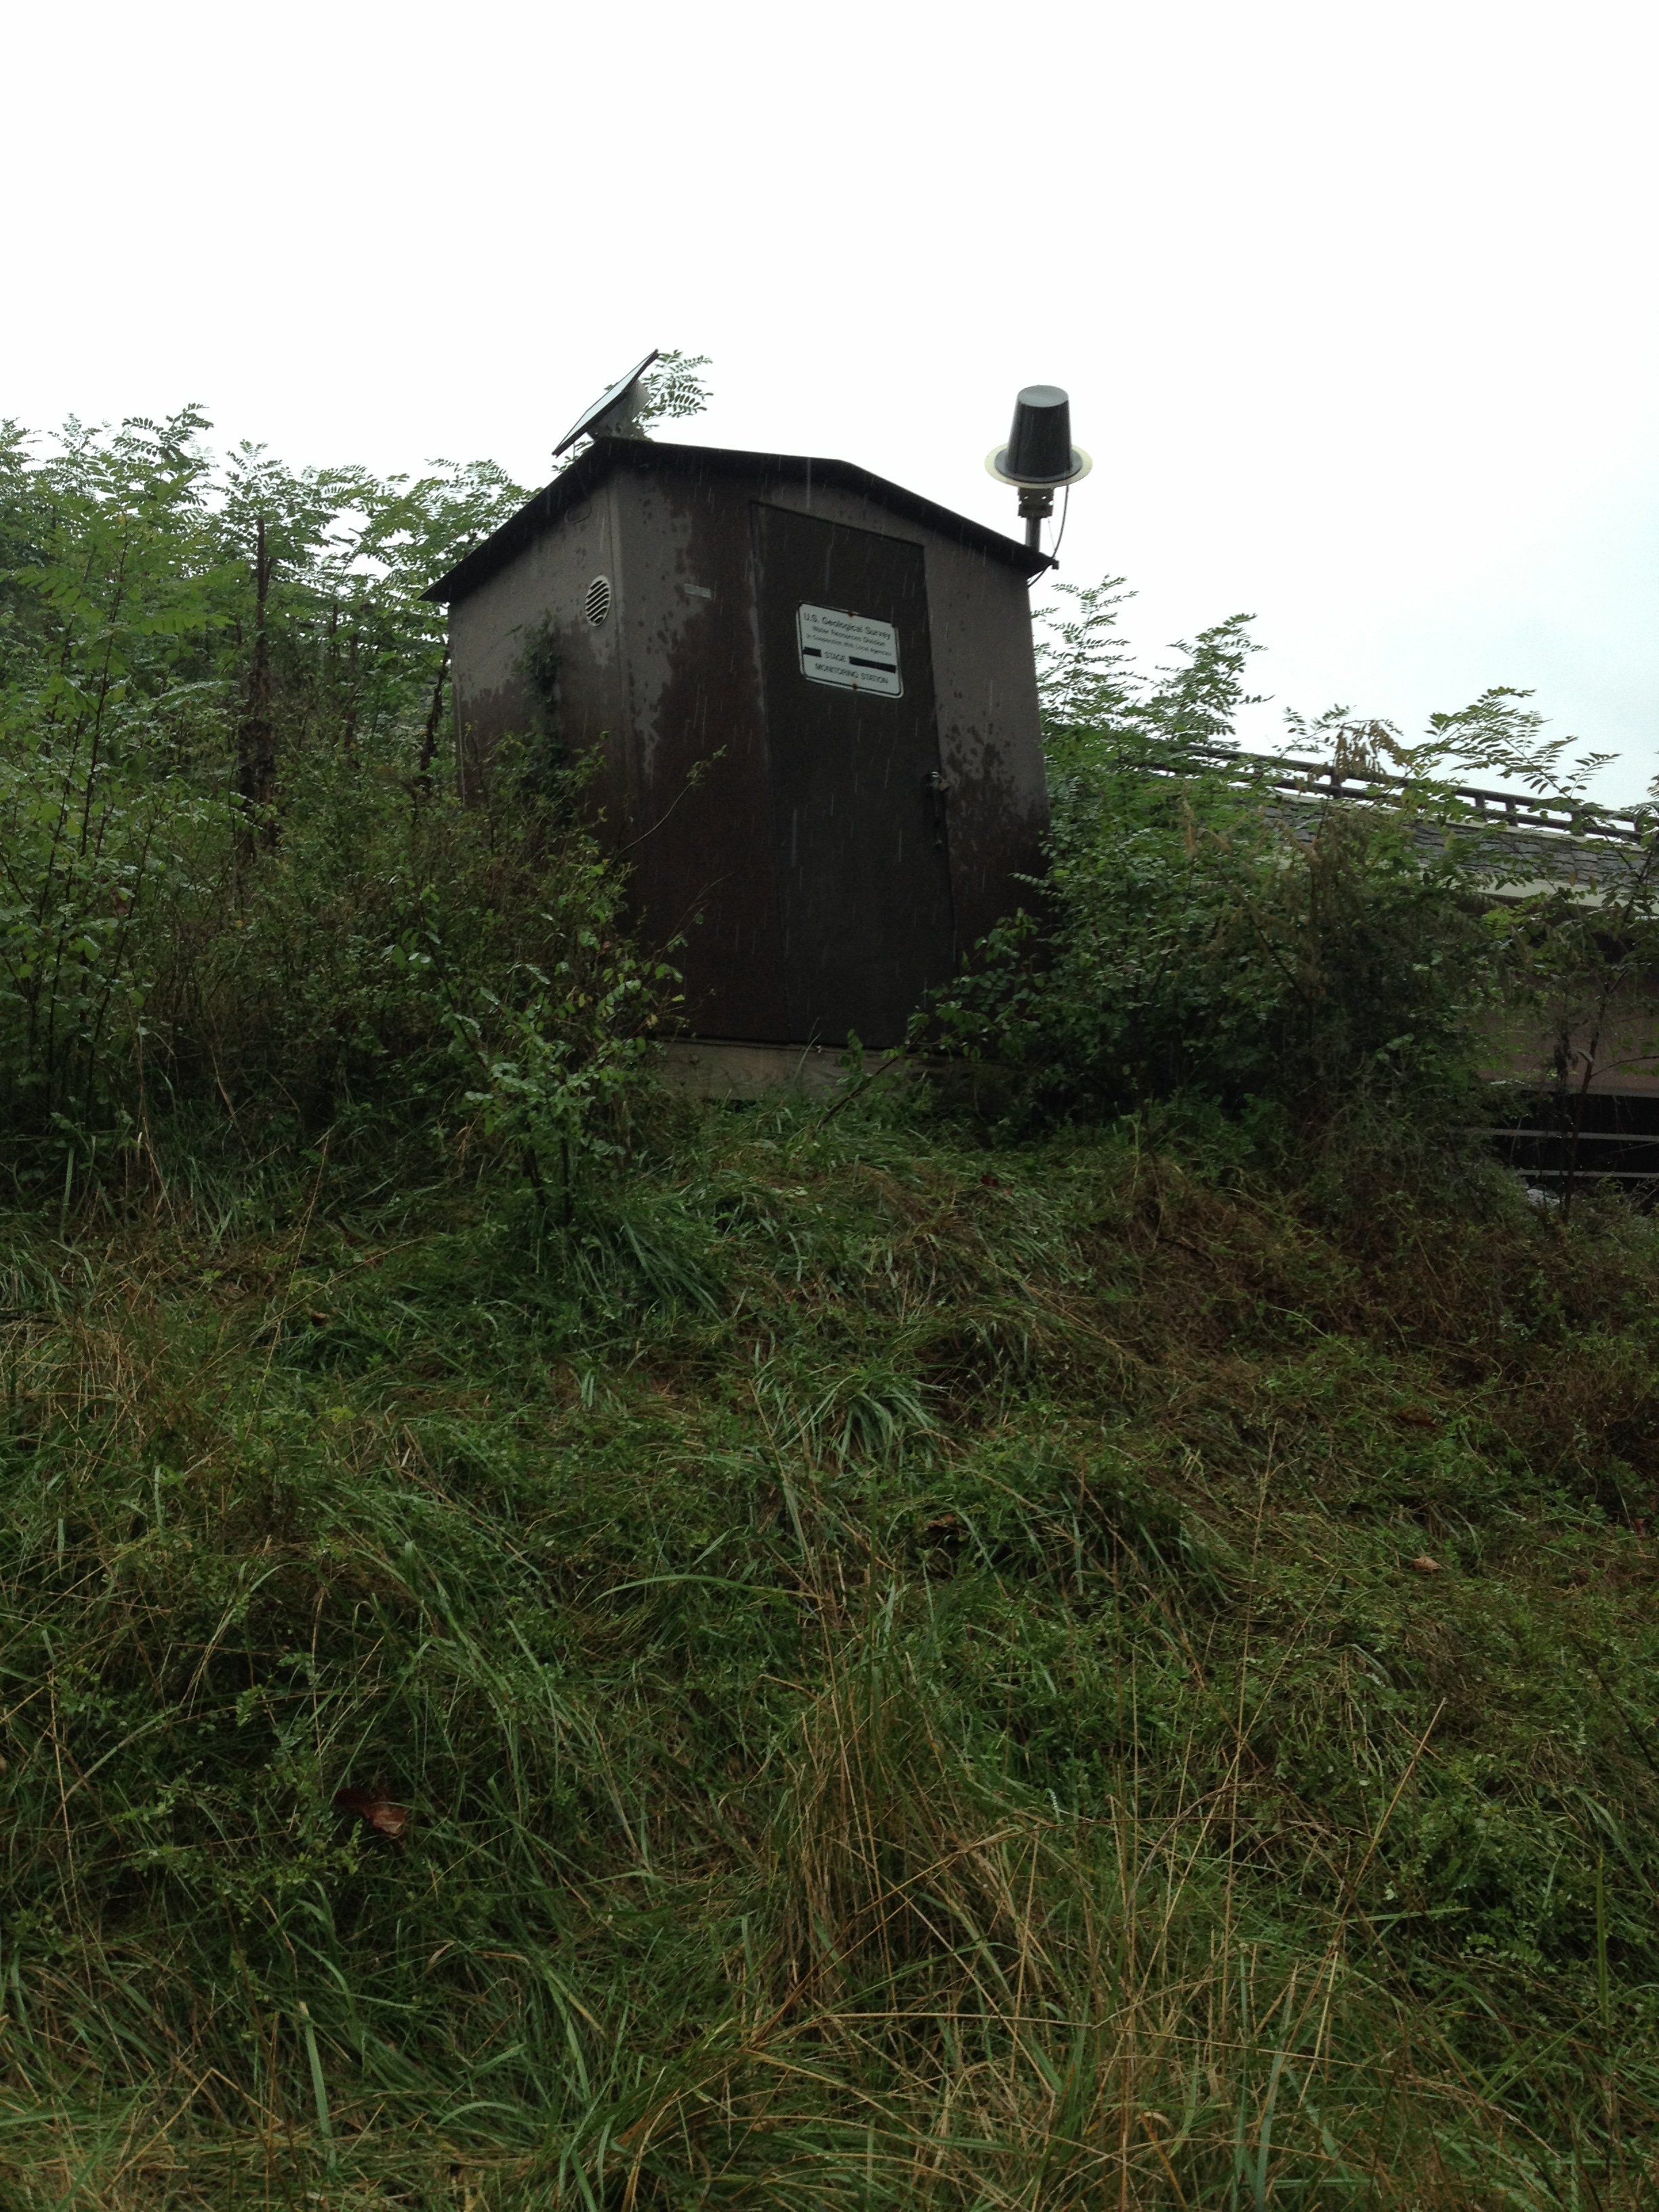 Station image

