LOCATION.--Lat 41°55'31", long
74°32'25" referenced to North American Datum of 1983,
Ulster County, NY, Hydrologic Unit 02040104, on left bank at
downstream side of bridge on Denning Road, 1.6 mi southwest of
Ladleton and 1.9 mi northeast of Claryville.
DRAINAGE AREA.--22.9 mi².
PERIOD OF RECORD.--July 1991 to current year.
GAGE.--Water-stage recorder and crest-stage gage. Datum
of gage is 1,727.44 ft above NAVD of 1988.
REMARKS.--Water Years 2014-24: Records fair except those
for estimated daily discharges, which are poor.
EXTREMES FOR PERIOD OF RECORD.--Maximum discharge, 7,650
ft³/s, Aug. 28, 2011, gage height, 13.61 ft, from rating curve
extended above 2,700 ft³/s on basis of runoff comparisons with
nearby stations; minimum discharge, 4.5 ft³/s, Aug. 12, 2002;
minimum gage height, 3.92 ft, Mar. 6, 2012.
PERIOD OF DAILY RECORD1.--SPECIFIC
CONDUCTANCE: January 2020 to September 2024. WATER
TEMPERATURE: January 2020 to September 2024.
INSTRUMENTATION1.--A continuous water-quality
monitor with water temperature and specific conductance
provides 15-minute-interval readings.
EXTREMES FOR PERIOD OF DAILY
RECORD1.--SPECIFIC CONDUCTANCE: Maximum, 83
uS/cm at 25 °C, Feb. 3, 2022; minimum, 7 uS/cm at 25 °C,
Oct. 14, 2022. WATER TEMPERATURE: Maximum, 22.8 °C, Aug.
8, 2022; minimum, -0.1 °C on several days during the 2020
water year winter period.
1 Water-Quality Records
 Site Information
 WaterAlert – get an
email or text (SMS) alert based on your chosen threshold.
WaterAlert – get an
email or text (SMS) alert based on your chosen threshold.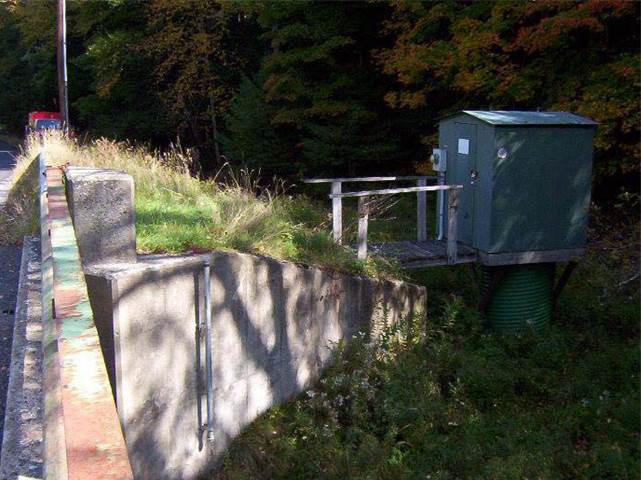 Station image

