LOCATION.--Lat 41°55'13.5", long
74°34'27.8" referenced to North American Datum of
1983, Sullivan County, NY, Hydrologic Unit 02040104, on left
bank about 50 ft upstream from bridge on County Highway 157 in
Claryville.
DRAINAGE AREA.--33.8 mi².
PERIOD OF RECORD.--July 1991 to current year.
GAGE.--Water-stage recorder and crest-stage gage. Datum
of gage is 1,615.82 ft above NAVD of 1988.
REMARKS.--Diversion upstream from station to maintain
lake volume at Frost Valley YMCA camp. Excess lake water is
diverted back into the river upstream from station.
Water Years 2014-24: Records fair except those for estimated
daily discharges, which are poor.
EXTREMES FOR PERIOD OF RECORD.--Maximum discharge,
11,600 ft³/s, Aug. 28, 2011, gage height, 15.38 ft, from rating
curve extended above 3,400 ft³/s on basis of runoff comparisons
with nearby stations; minimum discharge, 5.9 ft³/s, result of
freezeup, Mar. 14, 1993; minimum gage height, 3.61 ft, Aug. 27,
2005.
PERIOD OF RECORD (CLIM).--September 2019 to current
year.
INSTRUMENTATION (CLIM).--Air temperature thermistor
housed in radiation shield, mounted 8 ft above land
surface.
EXTREMES FOR PERIOD OF RECORD (CLIM).--Maximum air
temperature, 31.9°C, Aug. 4, 2022; minimum, -25.3°C, Jan. 22,
2022.
PERIOD OF RECORD1.-- SPECIFIC
CONDUCTANCE: January 2020 to current year. WATER TEMPERATURE:
January 2020 to current year.
INSTRUMENTATION1.--A continuous water-quality
monitor with water temperature and specific conductance
provides 15-minute-interval readings.
EXTREMES FOR PERIOD OF DAILY
RECORD1.--SPECIFIC CONDUCTANCE: Maximum, 43
uS/cm at 25 °C, Aug. 30, 2022; minimum, 13 uS/cm at 25 °C,
Oct. 26, 27, 2021. WATER TEMPERATURE: Maximum, 24.7 °C, July
27, 2020, June 30, 2021; minimum, 0.0 °C, on many days during
winter periods.
1 Water-Quality Records
 Site Information
 WaterAlert – get an
email or text (SMS) alert based on your chosen threshold.
WaterAlert – get an
email or text (SMS) alert based on your chosen threshold.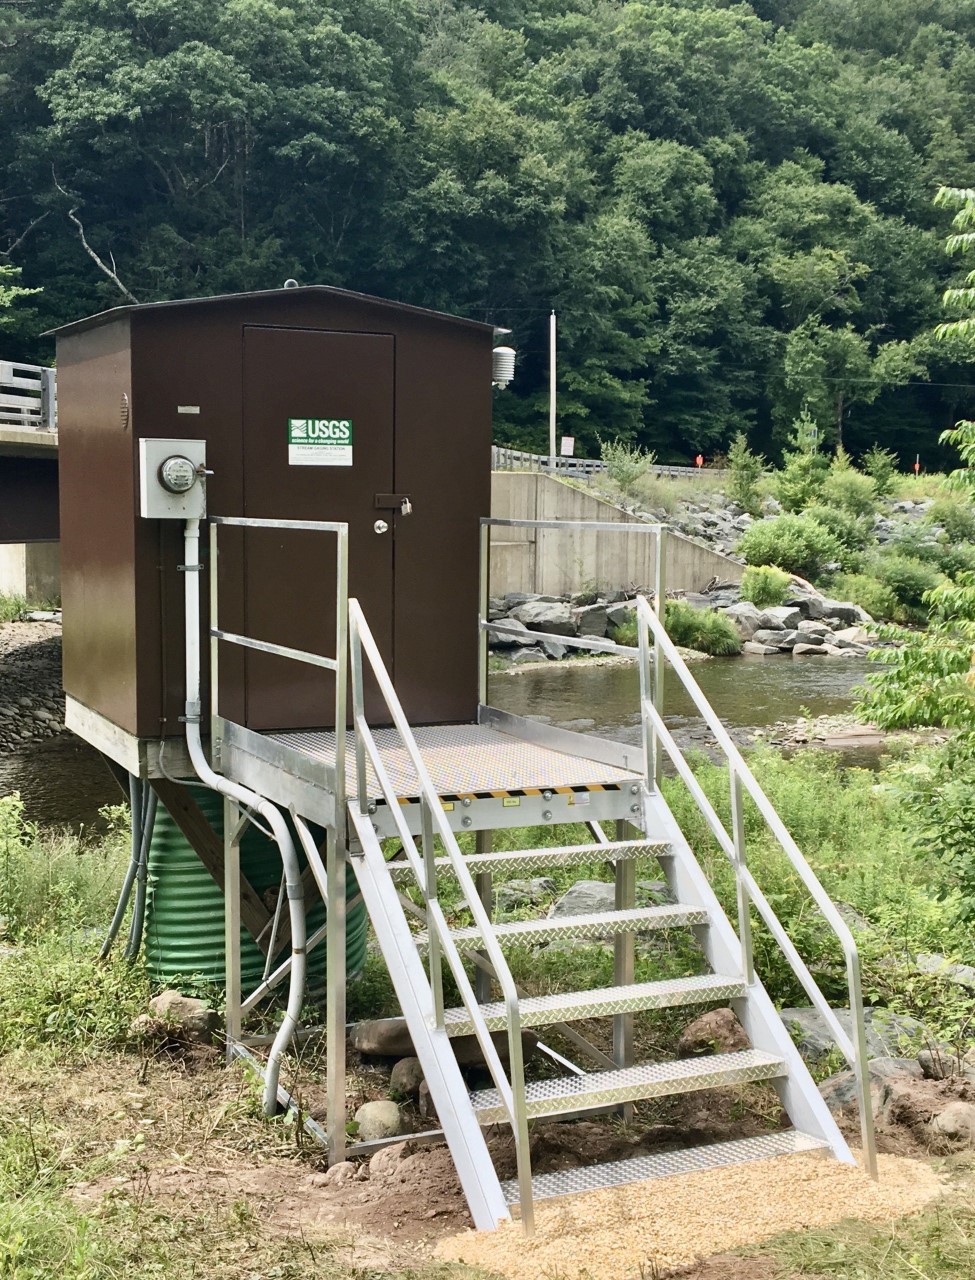 Station image
![Graph of DAILY Temperature, water, degrees Celsius, [Piezometer2.CS547A]](https://nadww01.er.usgs.gov/nwisweb/data/img/USGS.01434498.311650_311652_311654.00010.00001_00002_00003.20240609.20250609..0..gif)
![Graph of DAILY Temperature, water, degrees Celsius, [Piezometer3.CS547A]](https://nadww01.er.usgs.gov/nwisweb/data/img/USGS.01434498.312142_312143_312144.00010.00001_00002_00003.20240609.20250609..0..gif)


![Graph of DAILY Specific conductance, water, unfiltered, microsiemens per centimeter at 25 degrees Celsius, [Piezometer2]](https://nadww01.er.usgs.gov/nwisweb/data/img/USGS.01434498.339152_339153_339154.00095.00001_00002_00003.20240609.20250609..0..gif)
![Graph of DAILY Specific conductance, water, unfiltered, microsiemens per centimeter at 25 degrees Celsius, [Piezometer3(2)]](https://nadww01.er.usgs.gov/nwisweb/data/img/USGS.01434498.318994_339158.00095.00002_00003.20240609.20250609..0..gif)
![Graph of DAILY Specific conductance, water, unfiltered, microsiemens per centimeter at 25 degrees Celsius, [Piezometer3]](https://nadww01.er.usgs.gov/nwisweb/data/img/USGS.01434498.318993_339157_339159.00095.00001_00002_00003.20240609.20250609..0..gif)
![Graph of DAILY Groundwater level above NAVD 1988, feet, [Piezometer2]](https://nadww01.er.usgs.gov/nwisweb/data/img/USGS.01434498.311653.62611.00003.20240609.20250609..0..gif)
![Graph of DAILY Groundwater level above NAVD 1988, feet, [Piezometer3]](https://nadww01.er.usgs.gov/nwisweb/data/img/USGS.01434498.311651.62611.00003.20240609.20250609..0..gif)