|
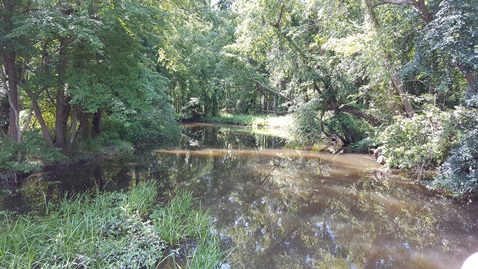 |
LOCATION.--Lat 38°43'42.0", long 75°33'42.7", Sussex County, DE, Hydrologic Unit 02080109, on left bank
at downstream side of highway bridge on county road No. 545, 800 ft downstream from Gum Branch, 2.5 mi
southeast of Bridgeville, and 50.5 mi upstream from mouth.
DRAINAGE AREA.--75.4 mi2.
PERIOD OF RECORD.--April 1943 to current year. Prior to October 1955, published as Gravelly Fork
near Bridgeville, DE.
REVISIONS HISTORY.--WSP 1111: 1947. WSP 1232: 1945-49.
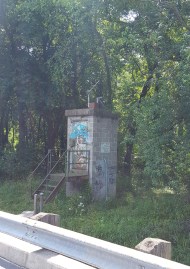
GAGE.--Water-stage recorder and crest-stage gage. Datum of gage is 12.82 ft above North American Vertical Datum of 1988.
Prior to Apr. 19, 1947, nonrecording gage, and Apr. 19, 1947 to Dec. 18, 1969, recording gage at present site and datum.
Timber control, Sept. 3, 1947 to Dec. 18, 1969. Feb. 18, 1970 to Oct. 1, 1973, recording gage at site 300 ft downstream
at same gage datum.
REMARKS.--U.S. Geological Survey satellite data-collection platform at station.
EXTREMES FOR PERIOD OF RECORD.--Maximum discharge, 3,020 ft3/s, Feb. 26, 1979, gage height, 10.31 ft;
minimum discharge, 6.3 ft3/s, Sept. 29, 1943.
EXTREMES OUTSIDE PERIOD OF RECORD.--Maximum stage known, about 11.0 ft in September 1935, from information
by local residents.
COOPERATION.--Funding for the operation of this station is provided by the U.S. Geological Survey.

