Funding for this site is provided by:
 STATION.
--01533400 SUSQUEHANNA RIVER AT MESHOPPEN,
PA
LOCATION.--Lat 41`36'26", long
76`03'02", Wyoming County, Hydrologic Unit 02050106, on right
bank 0.3 mi south of Meshoppen, 0.3 mi downstream from Meshoppen Creek,
2.3 mi upstream from bridge on State Highway 87, and 2.4 mi upstream
from Mehoopany Creek.
DRAINAGE AREA.--8,720 square miles.
PERIOD OF RECORD.--October 1976 to current year.
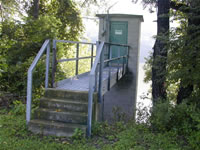
GAGE.--Water-stage recorder. Datum of gage is 599.1 ft
above North American Vertical Datum of 1988. Prior to November 10,
2022, the datum of gage was reported as 599.76 ft above National
Geodetic Vertical Datum of 1929. Satellite and landline telemetry at
station.
COOPERATION.--Funding for the operation of this
station is provided by the Pennsylvania Department of Environmental
Protection and the U.S. Geological Survey.
GAGE HEIGHTS OF IMPORTANCE.-
Supplied by USGS: Maximum recordable gage height
(stage sensor operational limit) - 47.2 ft; Data transmitter
operational limit - 48.6 ft;
Supplied by NWS: Action stage-25 ft; Flood stage-27
ft, minor flooding begins; About 8 homes have limited roadway access in
Mile Beach; Moderate flood stage-31 ft, homes and cottages on Mehoopany
side and in the Skinners Eddy and Tunkannock areas begin to be
affected; Major flood stage-40 ft, Many homes and roads on both sides
of the river begin to flood including the village of Meshoppen;
