Funding for this site is provided by:
 STATION.
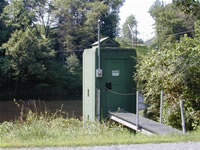
--01544000 FIRST FORK SINNEMAHONING CREEK
NEAR SINNEMAHONING, PA
LOCATION.--Lat 41`24'06", long
78`01'28", Cameron County, Hydrologic Unit 02050202, on right
bank on Township Route 357, 350 ft downstream from Woodrock Run, 1,500
ft upstream from Roaring Run, 0.8 mi downstream from George B.
Stevenson Dam (First Fork Sinnemahoning Creek Reservoir), and 7.5 mi
northeast of Sinnemahoning.
DRAINAGE AREA.--245 square miles.
PERIOD OF RECORD.--October 1953 to current year.
GAGE.--Water-stage recorder and crest-stage gage.
Datum of gage is 878.18 ft above North American Vertical Datum of 1988
(from benchmark). Prior to Apr. 1, 1954, non-recording gage at same
site and datum. Prior to March 13, 2024, the datum of gage was reported
as 878.71 ft above National Geodetic Vertical Datum of 1929. Satellite
telemetry at station.
COOPERATION.--Station established and maintained by
the U.S. Geological Survey. Funding for this station is provided by the
Pennsylvania Department of Environmental Protection, the Pennsylvania
Department of Conservation and Natural Resources and the U.S.
Geological Survey.
REMARKS.--Flow regulated since Jan 31, 1956 by George
B. Stevenson Dam.
GAGE HEIGHTS OF IMPORTANCE.-
Supplied by USGS: Data transmitter operational limit -
24.7 ft;
Supplied by NWS: No flood stage has been determined
for this station.
