Funding for this site is provided by:
 STATION.
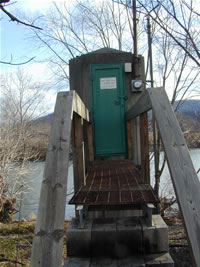
--01562000 RAYSTOWN BRANCH JUNIATA RIVER AT
SAXTON, PA
LOCATION.--Lat 40`12'57", long
78`15'56", Bedford County, Hydrologic Unit 02050303, on left
bank 500 ft downstream from bridge on State Highway 913, 0.5 mi west of
Saxton, and 1.5 mi upstream from Shoup Run.
DRAINAGE AREA.--756 square miles.
PERIOD OF RECORD.--September 1911 to current year.
Monthly discharge only for September 1911 published in WSP 1302.
GAGE.--Water-stage recorder and crest-stage gage.
Datum of gage is 795.77 ft above National Geodetic Vertical Datum of
1929. Prior to Oct. 1, 1931, nonrecording gage at site 0.8 mi
downstream at datum 4.82 ft lower.
COOPERATION.--Station established and maintained by
the U.S. Geological Survey. Funding for the operation of this station
is provided by the U.S. Army Corps of Engineers, Baltimore District,
the Pennsylvania Department of Environmental Protection, and the U.S.
Geological Survey.
GAGE HEIGHTS OF IMPORTANCE.-
Supplied by USGS: Maximum recordable gage height and
data transmitter operational limit - 25.2 ft;
Supplied by NWS: Action stage-14 ft; Flood stage-17
ft, the right or east bank begins to overflow affecting low lying
areas; few homes affected; Moderate flood stage-19 ft, several homes on
the right or east bank in Stonerstown and other low lying areas are
affected; Major flood stage-22 ft, the left or west bank overflows;
numerous homes are affected and a number of roads are closed.
