Warning: Javascript must be enabled to use all the features on this page!


Page Loading - Please Wait...

Click to hideNews Bulletins
! This page is undergoing modernization and will be decommissioned on February 2025. Daily data are now available in WDFN.
Try it out and tell us what you think at wdfn@usgs.gov
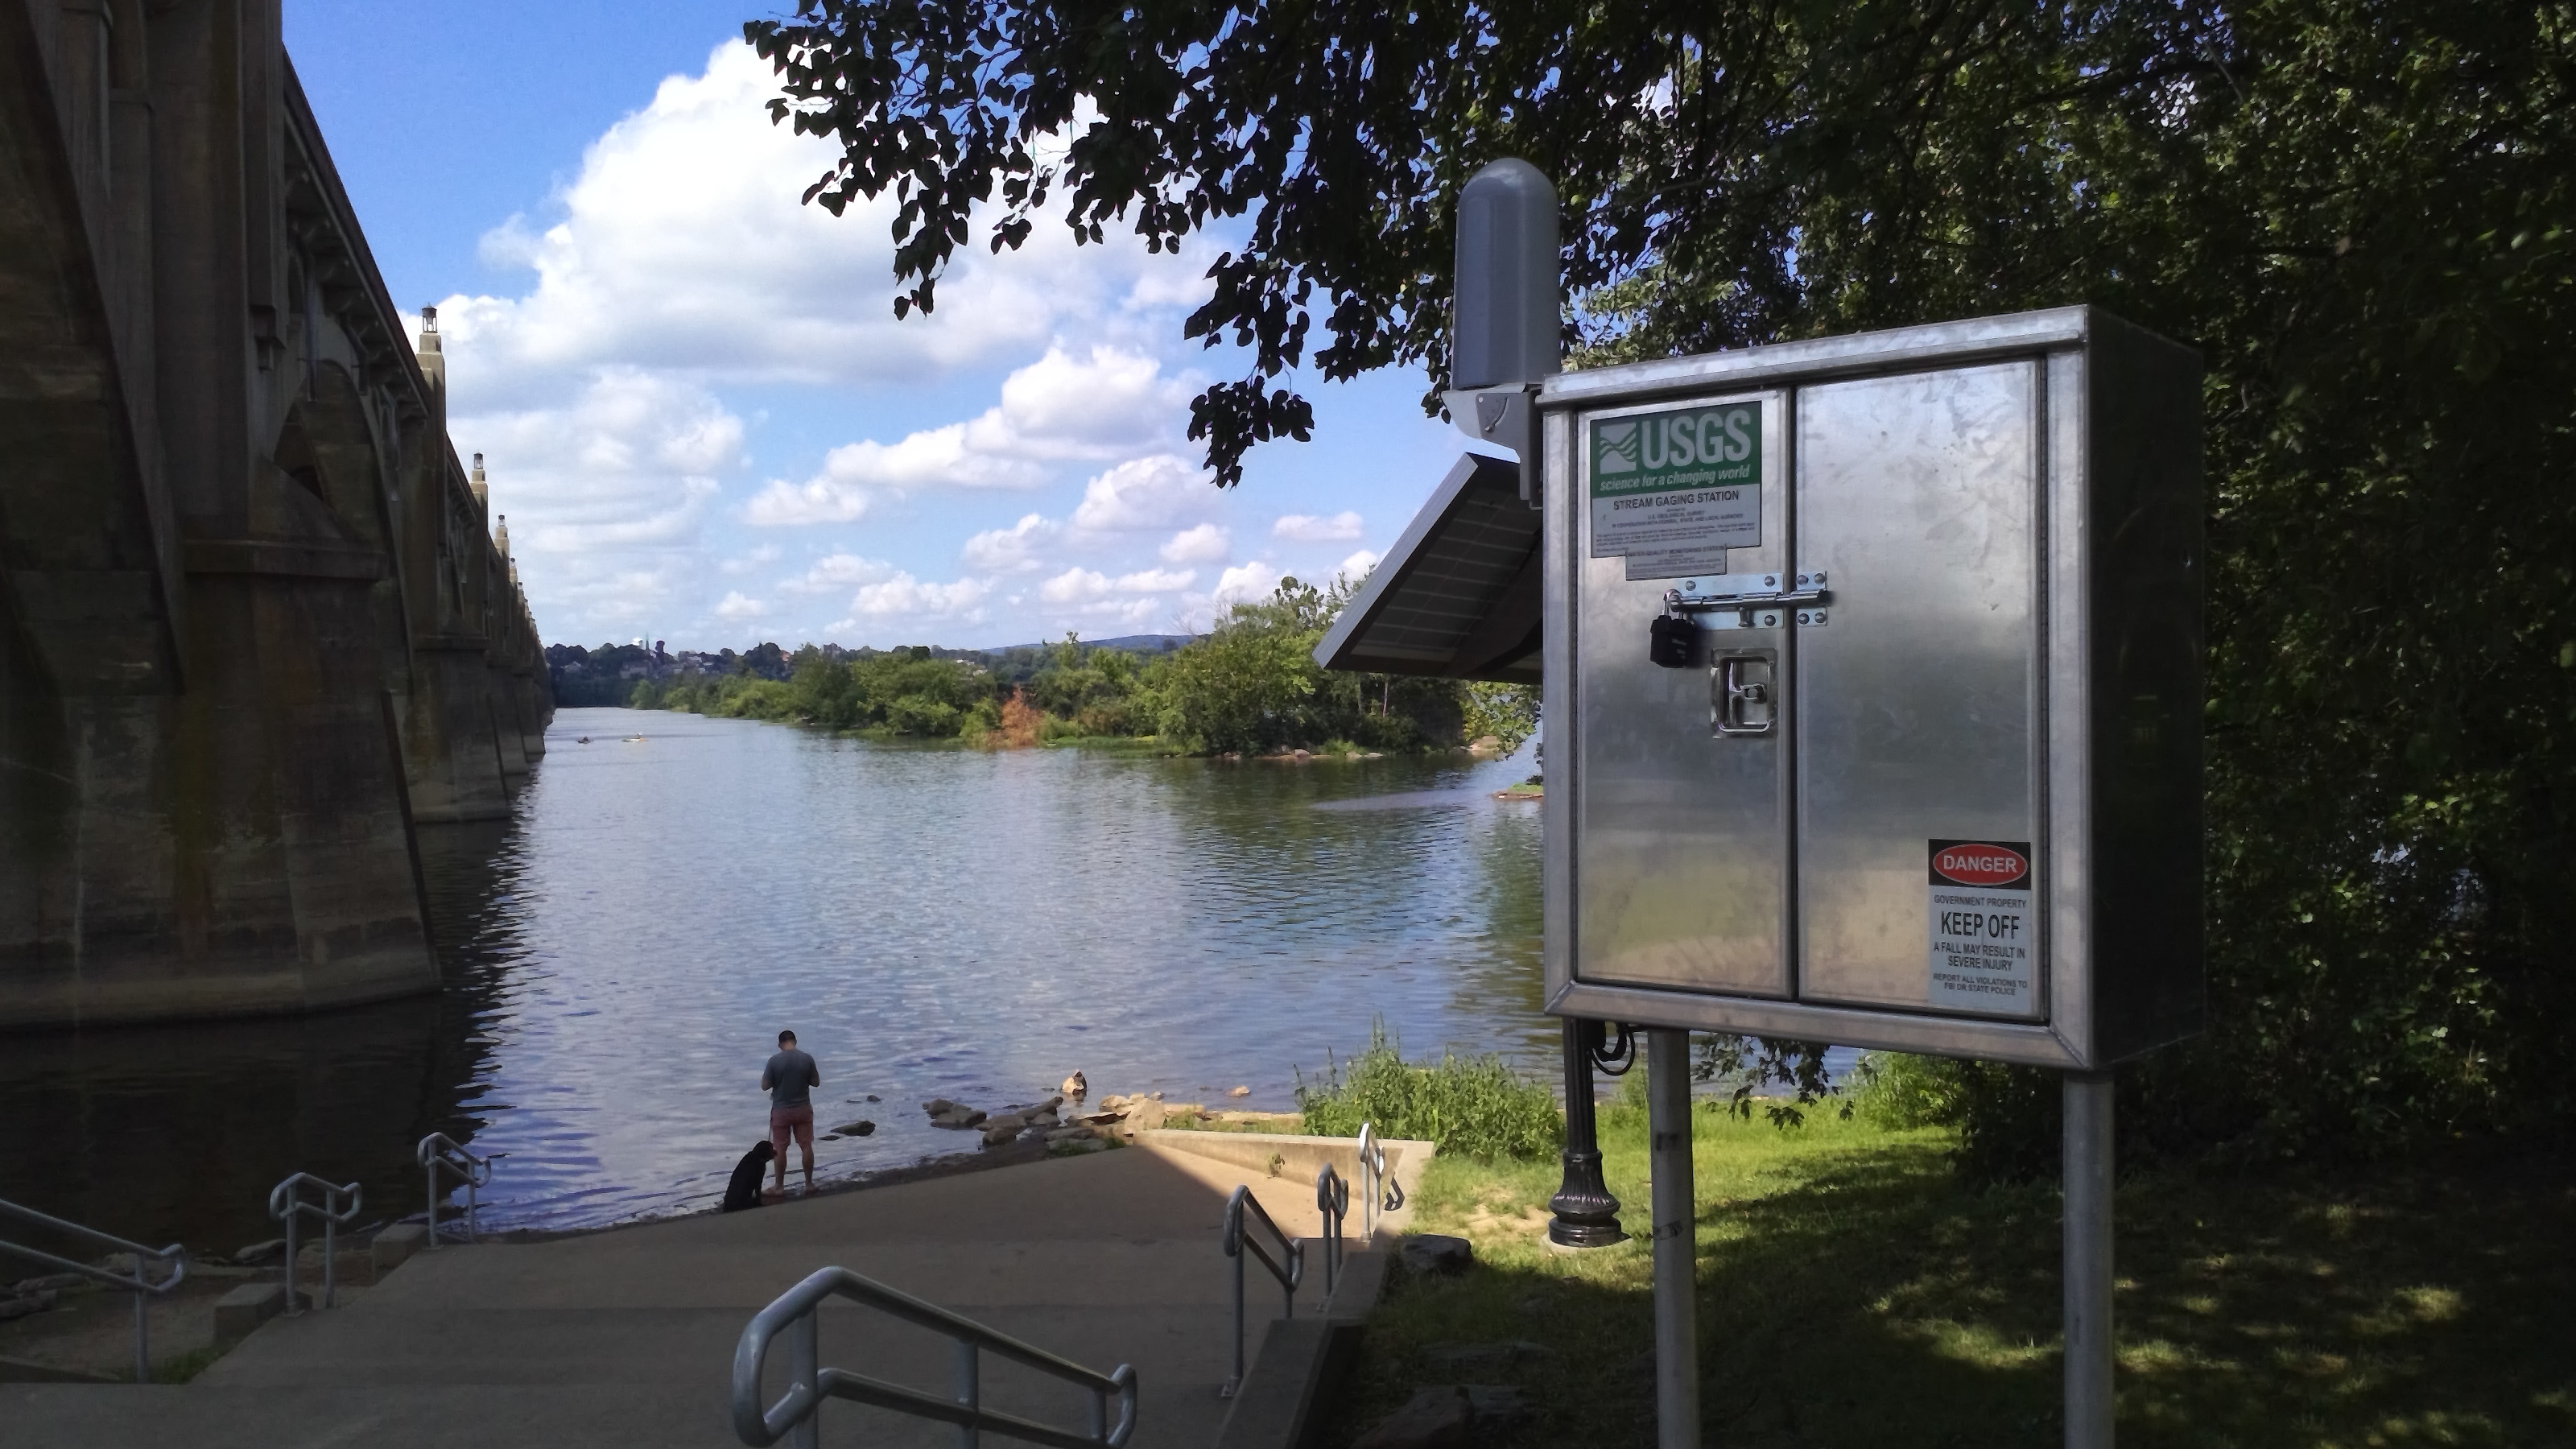
USGS 01576003 Susquehanna River at Columbia, PA

PROVISIONAL DATA SUBJECT TO REVISION

Click to hidestation-specific text


Station gage imageSTATION.--01576003 SUSQUEHANNA RIVER AT COLUMBIA, PA
LOCATION.--Lat 40`01'42", long 76`31'05", Lancaster County, Hydrologic Unit 02050306, on east shore at Columbia Crossing Heritage Park.
DRAINAGE AREA.--26,000 square miles.
PERIOD OF RECORD.--August 2022 to current year.
GAGE.--Three water-quality instruments at west, center and east locations in channel, interfaced via radio with a data logger/transmitter. Datum of gage is 288 ft above North American Vertical Datum of 1988.
COOPERATION.--Station established and maintained by the U.S. Geological Survey. Funding for the operation of this station is provided by the Pennsylvania Department of Environmental Protection.
This station managed by the PAWSC New Cumberland Office.

Available Parameters Period of Record
  
2022-08-18  2024-02-18
2022-08-18  2025-06-27
2022-08-18  2025-06-27
2022-08-18  2024-02-18
2022-08-18  2025-06-27
2022-08-18  2025-06-27
2022-10-19  2024-02-18
2022-08-18  2025-06-27
2022-08-18  2025-06-27
2022-08-18  2024-02-18
2022-08-18  2025-06-27
2022-08-18  2025-06-27
2022-08-18  2024-02-18
2022-08-18  2025-06-27
2022-08-18  2025-06-27
2022-08-18  2025-06-27
2022-08-18  2024-08-06
2022-08-18  2024-08-01


 (365)
 

  -- or --


Summary of all available data for this site
Instantaneous-data availability statement


Temperature, water, degrees Celsius, East


Graph of DAILY Temperature, water, degrees Celsius

Add up to 2 more sites and replot for "Temperature, water, degrees Celsius, East"

?


Create presentation-quality graph.  


Temperature, water, degrees Celsius, West


Graph of DAILY Temperature, water, degrees Celsius

Add up to 2 more sites and replot for "Temperature, water, degrees Celsius, West"

?


Create presentation-quality graph.  


Specific conductance, water, unfiltered, microsiemens per centimeter at 25 degrees Celsius, East


Graph of DAILY Specific conductance, water, unfiltered, microsiemens per centimeter at 25 degrees Celsius

Add up to 2 more sites and replot for "Specific conductance, water, unfiltered, microsiemens per centimeter at 25 degrees Celsius, East"

?


Create presentation-quality graph.  


Specific conductance, water, unfiltered, microsiemens per centimeter at 25 degrees Celsius, West


Graph of DAILY Specific conductance, water, unfiltered, microsiemens per centimeter at 25 degrees Celsius

Add up to 2 more sites and replot for "Specific conductance, water, unfiltered, microsiemens per centimeter at 25 degrees Celsius, West"

?


Create presentation-quality graph.  


Dissolved oxygen, water, unfiltered, milligrams per liter, East


Graph of DAILY Dissolved oxygen, water, unfiltered, milligrams per liter

Add up to 2 more sites and replot for "Dissolved oxygen, water, unfiltered, milligrams per liter, East"

?


Create presentation-quality graph.  


Dissolved oxygen, water, unfiltered, milligrams per liter, West


Graph of DAILY Dissolved oxygen, water, unfiltered, milligrams per liter

Add up to 2 more sites and replot for "Dissolved oxygen, water, unfiltered, milligrams per liter, West"

?


Create presentation-quality graph.  


pH, water, unfiltered, field, standard units, East


Graph of DAILY pH, water, unfiltered, field, standard units

Add up to 2 more sites and replot for "pH, water, unfiltered, field, standard units, East"

?


Create presentation-quality graph.  


pH, water, unfiltered, field, standard units, West


Graph of DAILY pH, water, unfiltered, field, standard units

Add up to 2 more sites and replot for "pH, water, unfiltered, field, standard units, West"

?


Create presentation-quality graph.  


Turbidity, water, unfiltered, monochrome near infra-red LED light, 780-900 nm, detection angle 90 +-2.5 degrees, formazin nephelometric units (FNU), East


Graph of DAILY Turbidity, water, unfiltered, monochrome near infra-red LED light, 780-900 nm, detection angle 90 +-2.5 degrees, formazin nephelometric units (FNU)

Add up to 2 more sites and replot for "Turbidity, water, unfiltered, monochrome near infra-red LED light, 780-900 nm, detection angle 90 +-2.5 degrees, formazin nephelometric units (FNU), East"

?


Create presentation-quality graph.  


Turbidity, water, unfiltered, monochrome near infra-red LED light, 780-900 nm, detection angle 90 +-2.5 degrees, formazin nephelometric units (FNU), West


Graph of DAILY Turbidity, water, unfiltered, monochrome near infra-red LED light, 780-900 nm, detection angle 90 +-2.5 degrees, formazin nephelometric units (FNU)

Add up to 2 more sites and replot for "Turbidity, water, unfiltered, monochrome near infra-red LED light, 780-900 nm, detection angle 90 +-2.5 degrees, formazin nephelometric units (FNU), West"

?


Create presentation-quality graph.  


Nitrate plus nitrite, water, in situ, milligrams per liter as nitrogen, Center


Graph of DAILY Nitrate plus nitrite, water, in situ, milligrams per liter as nitrogen

Add up to 2 more sites and replot for "Nitrate plus nitrite, water, in situ, milligrams per liter as nitrogen, Center"

?


Create presentation-quality graph.  


Nitrate plus nitrite, water, in situ, milligrams per liter as nitrogen, East


Graph of DAILY Nitrate plus nitrite, water, in situ, milligrams per liter as nitrogen

Add up to 2 more sites and replot for "Nitrate plus nitrite, water, in situ, milligrams per liter as nitrogen, East"

?


Create presentation-quality graph.  


Nitrate plus nitrite, water, in situ, milligrams per liter as nitrogen, West


Graph of DAILY Nitrate plus nitrite, water, in situ, milligrams per liter as nitrogen

Add up to 2 more sites and replot for "Nitrate plus nitrite, water, in situ, milligrams per liter as nitrogen, West"

?


Create presentation-quality graph.