Warning: Javascript must be enabled to use all the features on this page!


Page Loading - Please Wait...

Click to hideNews Bulletins

USGS 01589290 SCOTTS LEVEL BRANCH AT ROCKDALE, MD

PROVISIONAL DATA SUBJECT TO REVISION

Click to hidestation-specific text
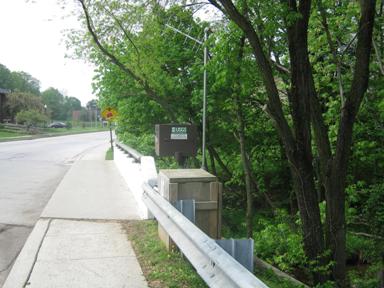
LOCATION.--Lat 39°21'41.7, long 76°45'42.3", Baltimore County, MD, Hydrologic Unit 02060003, 
   on left bank at upstream side of bridge on Rolling Road, 0.40 mi northeast of Liberty 
   Road (State Route 26), and 0.50 mi upstream from mouth.
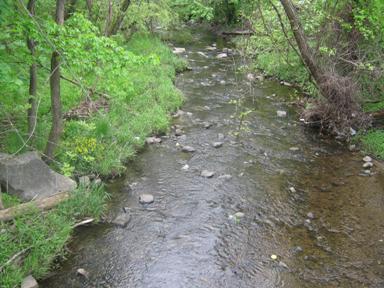
DRAINAGE AREA.--3.23 mi2.
PERIOD OF RECORD.--October 2005 to current year.
REVISIONS HISTORY.--WDR-US-2009: 2006-2008. https://waterdata.usgs.gov/nwis/dv/?site_no=01589290: 2016. https://waterdata.usgs.gov/nwis/dv/?site_no=01589290: 2018-2020.
GAGE.--Water-stage recorder and crest-stage gage. Datum of gage is 452.36 ft above North 
   American Vertical Datum of 1988.
REMARKS.--U.S. Geological Survey satellite data-collection platform at station.
EXTREMES FOR PERIOD OF RECORD.--Maximum discharge, 2,440 ft3/s, July 30, 2016,
   gage height, 7.83 ft; minimum discharge, 0.14 ft3/s, Oct. 5-9, 2007.
COOPERATION.--Funding for the operation of this station is provided by the Baltimore County
   Department of Environmental Protection & Sustainability, and the U.S. Geological Survey. 
Boating safety tips
This station managed by the MD-DE-DC Water Science Center Baltimore office.

Available Parameters Period of Record
  
2016-01-16  2024-04-18
2005-09-30  2024-04-18
2016-01-16  2024-04-18
2019-10-01  2024-04-18
2019-10-01  2024-04-18
2015-10-17  2020-04-28
2015-10-01  2021-09-30
2015-10-01  2021-09-30


 (365)
 

  -- or --


Summary of all available data for this site
Instantaneous-data availability statement


Temperature, water, degrees Celsius


Graph of DAILY Temperature, water, degrees Celsius

Add up to 2 more sites and replot for "Temperature, water, degrees Celsius"

?


Create presentation-quality graph.  


Discharge, cubic feet per second


Graph of DAILY Discharge, cubic feet per second

Add up to 2 more sites and replot for "Discharge, cubic feet per second"

?


Create presentation-quality graph.  


Specific conductance, water, unfiltered, microsiemens per centimeter at 25 degrees Celsius


Graph of DAILY Specific conductance, water, unfiltered, microsiemens per centimeter at 25 degrees Celsius

Add up to 2 more sites and replot for "Specific conductance, water, unfiltered, microsiemens per centimeter at 25 degrees Celsius"

?


Create presentation-quality graph.  


pH, water, unfiltered, field, standard units


Graph of DAILY pH, water, unfiltered, field, standard units

Add up to 2 more sites and replot for "pH, water, unfiltered, field, standard units"

?


Create presentation-quality graph.  


Turbidity, water, unfiltered, monochrome near infra-red LED light, 780-900 nm, detection angle 90 +-2.5 degrees, formazin nephelometric units (FNU)


Graph of DAILY Turbidity, water, unfiltered, monochrome near infra-red LED light, 780-900 nm, detection angle 90 +-2.5 degrees, formazin nephelometric units (FNU)

Add up to 2 more sites and replot for "Turbidity, water, unfiltered, monochrome near infra-red LED light, 780-900 nm, detection angle 90 +-2.5 degrees, formazin nephelometric units (FNU)"

?


Create presentation-quality graph.