USGS 13269000 SNAKE RIVER AT WEISER ID

PROVISIONAL DATA SUBJECT TO REVISION

Click to hidestation-specific text
Snake River at Weiser, ID - USGS file photo USGS Idaho Water Science Center celebrating more than 100 Years of streamgage Records

> Rating Information

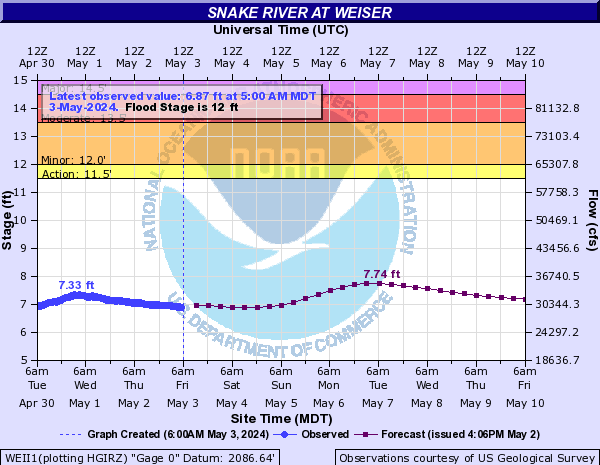
> NWS River Forecasts

Station is operated in cooperation with the Bonneville Power Administration .

Effective Immediately: Due to loss of funding, temperature data collection and publication will no longer be available at this site. This does not apply to historical temperature data which will remain available. If you have any questions or concerns please contact David Evetts (devetts@usgs.gov) at 208-387-1316 for additional information.
This station managed by the Boise Field Office.

Available Parameters Available Period
  
2007-10-01  2025-04-02
1986-10-01  2025-04-02
2007-10-01  2025-04-02


 (7)
 

  -- or --


Summary of all available data for this site
Instantaneous-data availability statement


Temperature, water, degrees Celsius

Most recent instantaneous value: 7.7 04-02-2025   18:00 MDT
Graph of  Temperature, water, degrees Celsius

Add up to 2 more sites and replot for "Temperature, water, degrees Celsius"

?


Create presentation-quality / stand-alone graph.   Subscribe to WaterAlert      

See this graph on the Monitoring Location Pages


Discharge, cubic feet per second

Most recent instantaneous value: 29300 04-02-2025   18:00 MDT
Graph of  Discharge, cubic feet per second

Add up to 2 more sites and replot for "Discharge, cubic feet per second"

?


Create presentation-quality / stand-alone graph.   Subscribe to WaterAlert      

See this graph on the Monitoring Location Pages


Daily discharge, cubic feet per second -- statistics for Apr 2 based on 114 water years of record more
Min
(1992)
25th
percen-
tile
Median Mean Most Recent
Instantaneous
Value Apr 2
75th
percen-
tile
Max
(2017)
8330 13600 20800 24600 29300 33900 67000


Gage height, feet

Most recent instantaneous value: 6.83 04-02-2025   18:00 MDT
Graph of  Gage height, feet

Add up to 2 more sites and replot for "Gage height, feet"

?


Create presentation-quality / stand-alone graph.   Subscribe to WaterAlert      

See this graph on the Monitoring Location Pages