USGS 01127768 THAMES R AT GROTON, CT.

PROVISIONAL DATA SUBJECT TO REVISION

Available Parameters Available Period
  
2020-06-05  2025-07-11
2022-10-26  2025-07-11
2020-06-05  2025-07-09
2022-10-26  2025-07-11
2020-06-05  2025-07-11
2022-10-26  2025-07-11
2020-06-05  2025-07-09
2022-10-26  2025-07-11
2020-06-05  2025-07-11
2022-10-26  2025-07-11
2020-06-05  2025-07-03
2020-06-05  2025-07-02
2020-06-05  2025-07-09
2022-10-26  2025-07-11


 (7)
 

  -- or --


Summary of all available data for this site
Instantaneous-data availability statement


Temperature, water, degrees Celsius, BOTTOM

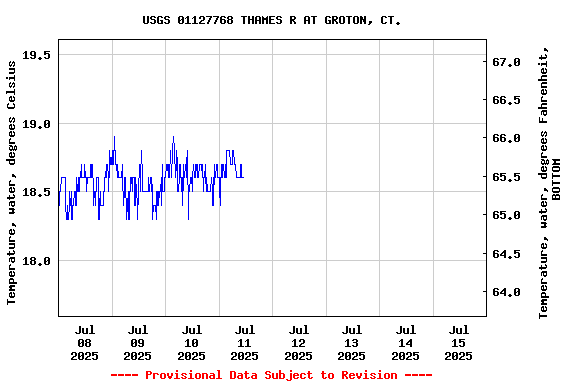
Most recent instantaneous value: 18.6 07-11-2025   11:00 EDT
Graph of  Temperature, water, degrees Celsius

Add up to 2 more sites and replot for "Temperature, water, degrees Celsius, BOTTOM"

?


Create presentation-quality / stand-alone graph.   Subscribe to WaterAlert      

See this graph on the Monitoring Location Pages


Temperature, water, degrees Celsius, TOP

Most recent instantaneous value: 20.5 07-11-2025   09:45 EDT
Graph of  Temperature, water, degrees Celsius

Add up to 2 more sites and replot for "Temperature, water, degrees Celsius, TOP"

?


Create presentation-quality / stand-alone graph.   Subscribe to WaterAlert      

See this graph on the Monitoring Location Pages


Specific conductance, water, unfiltered, microsiemens per centimeter at 25 degrees Celsius, BOTTOM

Most recent instantaneous value: 44600 07-11-2025   11:00 EDT
Graph of  Specific conductance, water, unfiltered, microsiemens per centimeter at 25 degrees Celsius

Add up to 2 more sites and replot for "Specific conductance, water, unfiltered, microsiemens per centimeter at 25 degrees Celsius, BOTTOM"

?


Create presentation-quality / stand-alone graph.   Subscribe to WaterAlert      

See this graph on the Monitoring Location Pages


Specific conductance, water, unfiltered, microsiemens per centimeter at 25 degrees Celsius, TOP

Most recent instantaneous value: 37000 07-09-2025   06:45 EDT
Graph of  Specific conductance, water, unfiltered, microsiemens per centimeter at 25 degrees Celsius

Add up to 2 more sites and replot for "Specific conductance, water, unfiltered, microsiemens per centimeter at 25 degrees Celsius, TOP"

?


Create presentation-quality / stand-alone graph.   Subscribe to WaterAlert      

See this graph on the Monitoring Location Pages


Dissolved oxygen, water, unfiltered, milligrams per liter, BOTTOM

Most recent instantaneous value: 6.3 07-11-2025   11:00 EDT
Graph of  Dissolved oxygen, water, unfiltered, milligrams per liter

Add up to 2 more sites and replot for "Dissolved oxygen, water, unfiltered, milligrams per liter, BOTTOM"

?


Create presentation-quality / stand-alone graph.   Subscribe to WaterAlert      

See this graph on the Monitoring Location Pages


Dissolved oxygen, water, unfiltered, milligrams per liter, TOP

Most recent instantaneous value: 6.4 07-11-2025   09:45 EDT
Graph of  Dissolved oxygen, water, unfiltered, milligrams per liter

Add up to 2 more sites and replot for "Dissolved oxygen, water, unfiltered, milligrams per liter, TOP"

?


Create presentation-quality / stand-alone graph.   Subscribe to WaterAlert      

See this graph on the Monitoring Location Pages


pH, water, unfiltered, field, standard units, BOTTOM

Most recent instantaneous value: 7.9 07-11-2025   11:00 EDT
Graph of  pH, water, unfiltered, field, standard units

Add up to 2 more sites and replot for "pH, water, unfiltered, field, standard units, BOTTOM"

?


Create presentation-quality / stand-alone graph.   Subscribe to WaterAlert      

See this graph on the Monitoring Location Pages


pH, water, unfiltered, field, standard units, TOP

Most recent instantaneous value: 7.7 07-11-2025   09:45 EDT
Graph of  pH, water, unfiltered, field, standard units

Add up to 2 more sites and replot for "pH, water, unfiltered, field, standard units, TOP"

?


Create presentation-quality / stand-alone graph.   Subscribe to WaterAlert      

See this graph on the Monitoring Location Pages