PROVISIONAL DATA SUBJECT TO REVISION
Click to hidestation-specific text
Funding for this site is provided by:
 Site Information
LOCATION.--Lat 41°02'39.5", long
72°19'01.1" referenced to North American Datum of
1983, Suffolk County, NY, Hydrologic Unit 02030202, at South
Ferry Inc. ferry service property.
PERIOD OF RECORD.--November 2020 to current year.
GAGE.--Water-stage recorder. Estuary elevation record is available in ft above NGVD of 1929 and ft above NAVD of 1988.
REMARKS.--Satellite and modem telemeter for elevation at station. Elevations are not corrected for changes in water density. Blanks in tables are the result of only one high or low tide during a day or interruption of record. Gaps in record caused by equipment malfunctions are estimated by comparison with estuary elevation data from USGS station 01304200 Orient Harbor at Orient, NY.
EXTREMES FOR PERIOD OF RECORD.--Maximum elevation, 5.78 ft above NGVD of 1929 (4.84 ft above NAVD of 1988), Apr. 4, 2024; minimum elevation, -2.46 ft above NGVD of 1929 (-3.40 ft above NAVD of 1988), Mar. 2, 2021.
PERIOD OF DAILY RECORD1.--WATER TEMPERATURE: September 2022 to current. SALINITY: September 2022 to current. pH: September 2022 to current. DISSOLVED OXYGEN: September 2022 to current. TURBIDITY: September 2022 to current. TAL-PE: September 2022 to current.
INSTRUMENTATION1.--Water-quality monitor provides 6-minute-interval readings collected from 1.5 ft above the bottom. Multi-parameter water-quality sonde measures temperature, specific conductance, pH, dissolved oxygen, turbidity, and TAL-PE.
EXTREMES FOR PERIOD OF DAILY RECORD1.--WATER TEMPERATURE: Maximum, 27.7 'C, July 29, 2023; minimum, -1.2 'C, Jan. 28, 2025.
SALINITY: Maximum, 32.0 psu, Dec. 27, 2022; minimum, 25.6 psu, May 16, 2024.
pH: Maximum, 8.3 standard units, several days in January 2024; minimum, 7.3 standard units, Sept. 11, 2023.
DISSOLVED OXYGEN: Maximum, 13.2 mg/L, Jan. 24, 25, 26, 2025; minimum, 2.3 mg/L, July 13, 2023.
TURBIDITY: Maximum, 67.6 FNU, Dec. 24, 2022; minimum, <0.3 FNU, on many days. [<, actual value is known to be less than the value shown]
CHLOROPHYLL FLUORESCENCE: Maximum, 121.41 ug/L, 30.23 RFU, Apr. 5, 2024; minimum, 0.00 ug/L, 0.00 RFU, on several days.
PHYCOERETHRINE FLUORESCENCE: Maximum, >280 ug/L, >100 RFU, Feb. 16, 2025; minimum, 0.00 ug/L, 0.00 RFU, on several days.
1 Water-Quality Records
 WaterAlert – get an
email or text (SMS) alert based on your chosen threshold. Additional Site
Information
WaterAlert – get an
email or text (SMS) alert based on your chosen threshold. Additional Site
Information
NAVD 1988 Datum Conversion Information
|
Elevation observations and tidal predictions for this station are reported to NGVD 1929. To convert data to NAVD 1988 subtract 0.95 ft. To convert data to MHHW datum subtract 2.20 ft. To convert data to MLLW datum add 1.13 ft. These corrections vary from site to site. |
|
NGVD
1929 is the National Geodetic Vertical Datum of 1929,
formerly called "mean sea level" or "Sea
Level Datum of 1929." NGVD 1929 was a general
adjustment of the first-order level nets fit to mean sea
level at 26 tide gages in the US and Canada.
NAVD 1988 is the North American Vertical Datum of 1988, which is a geodetic datum derived from a general adjustment of the first-order level nets fit to 1 tide gage in eastern Canada. MHHW is mean higher high water, which is a site-specific datum determined by averaging the highest of the 2 high tides that occur each day over a 19-year tidal epoch. For tide gages with less than 19 years of record, this datum is estimated by correlation with long-term tide gages. MLLW is mean lower low water, which is a site-specific datum determined by averaging the lowest of the 2 low tides that occur each day over a 19-year tidal epoch. For tide gages with less than 19 years of record, this datum is estimated by correlation with long-term tide gages. |
Additional sensor graph(s) available (click on graph or sensor name)
Water elevation, astronomical-tide elevation, and residual water level Graph updated every 15 minutes
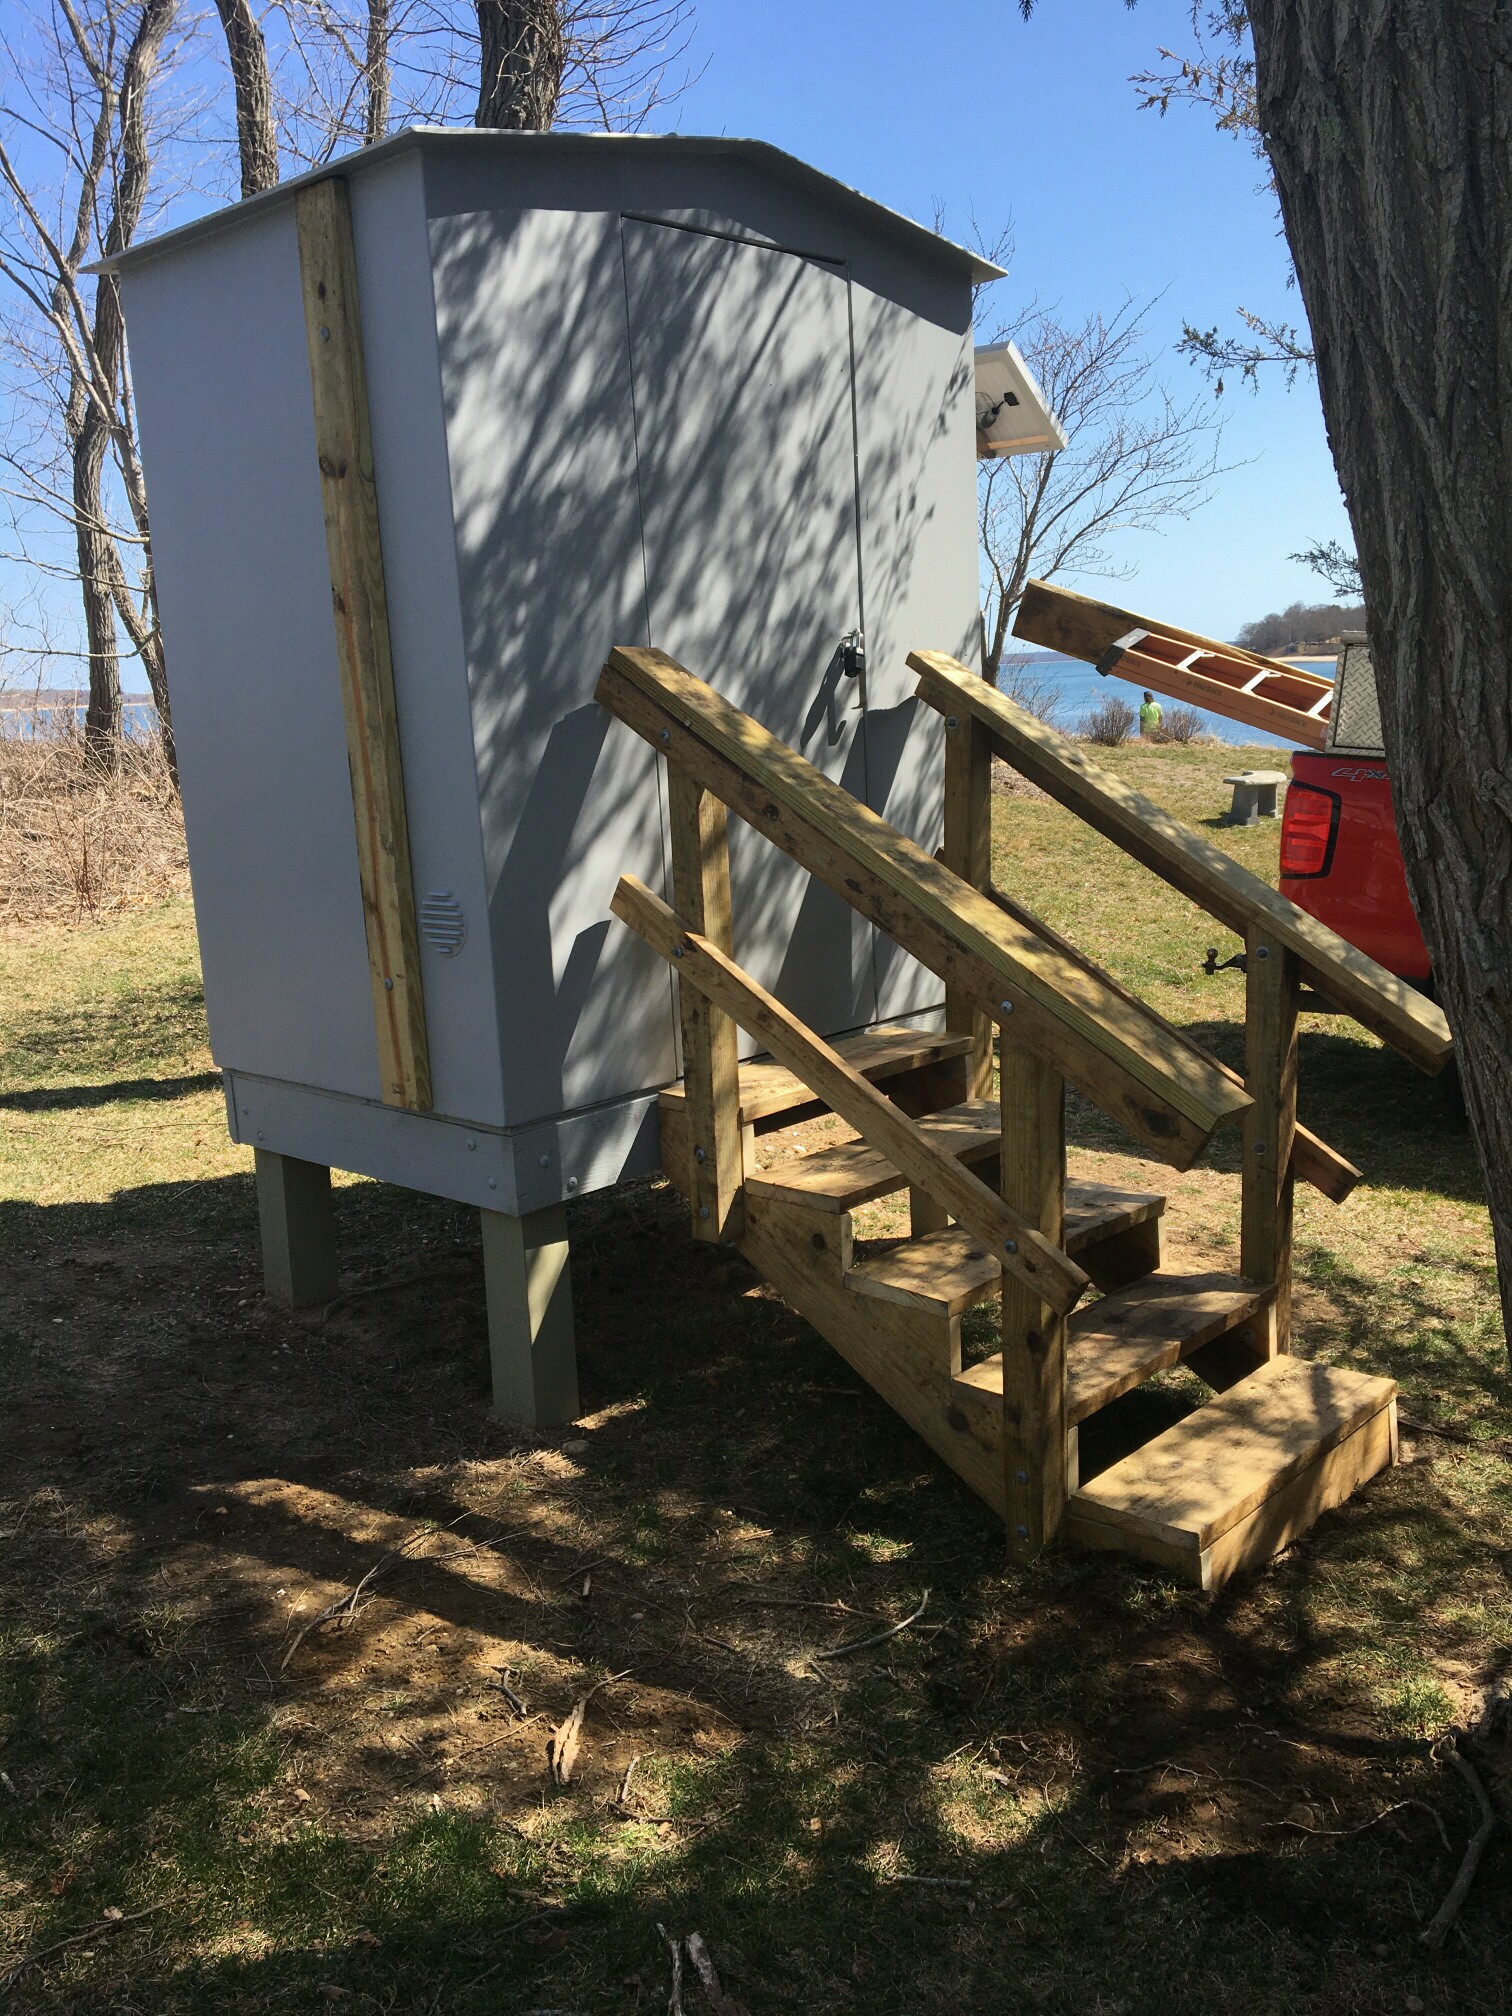 Station image
Summary of all available data for this site
Instantaneous-data availability statement


