USGS 01478220 West Branch White Clay Creek near Chesterville, PA

PROVISIONAL DATA SUBJECT TO REVISION

Click to hidestation-specific text
Funding for this site is provided by:


Station gage image
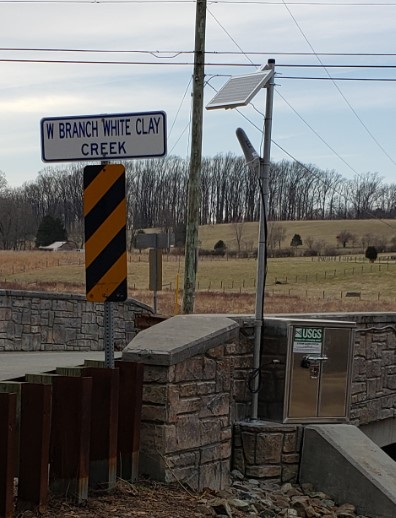
STATION.--01478220 WEST BRANCH WHITE CLAY CREEK NEAR CHESTERVILLE, PA
LOCATION.--Lat 39`45'56", long 75`47'47", Chester County, Hydrologic Unit 02040205, on the right bank, downstream side of N Creek Rd, 280 ft from the mouth, 1.5 miles southwest of Landenberg.
DRAINAGE AREA.--9.92 square miles.
PERIOD OF RECORD.--March 2020 to current year.
GAGE.--Water-stage recorder, crest-stage gage, and water-quality monitor. Datum of gage is 177.2 ft above North American Vertical Datum of 1988 from single-base GNSS rapid static survey. Satelite telemetry at station.
COOPERATION.--Station established and maintained by the U.S. Geological Survey. Funding for this station is provided by the U.S. Geological Survey.
This station managed by the PAWSC Downingtown Field Office.

Available Parameters Available Period
  
2020-03-05  2024-04-18
2020-03-09  2024-04-18
2020-03-09  2024-04-18
2020-03-05  2024-04-18
2022-01-01  2024-04-18
2020-07-23  2024-04-18


 (7)
 

  -- or --


Summary of all available data for this site
Instantaneous-data availability statement


Temperature, water, degrees Celsius

Most recent instantaneous value: 15.1 04-18-2024   17:00 EDT
Graph of  Temperature, water, degrees Celsius

Add up to 2 more sites and replot for "Temperature, water, degrees Celsius"

?


Create presentation-quality / stand-alone graph.   Subscribe to WaterAlert      

See this graph on the Monitoring Location Pages


Specific conductance, water, unfiltered, microsiemens per centimeter at 25 degrees Celsius

Most recent instantaneous value: 238 04-18-2024   17:00 EDT
Graph of  Specific conductance, water, unfiltered, microsiemens per centimeter at 25 degrees Celsius

Add up to 2 more sites and replot for "Specific conductance, water, unfiltered, microsiemens per centimeter at 25 degrees Celsius"

?


Create presentation-quality / stand-alone graph.   Subscribe to WaterAlert      

See this graph on the Monitoring Location Pages