PROVISIONAL DATA SUBJECT TO REVISION
Click to hidestation-specific text
 LOCATION.--Lat
39°25'27.9", long 77°25'47.2", Frederick County, MD,
Hydrologic Unit 02070009, on left bank 375 ft upstream from culvert on
US Route 15 (Frederick Freeway),
LOCATION.--Lat
39°25'27.9", long 77°25'47.2", Frederick County, MD,
Hydrologic Unit 02070009, on left bank 375 ft upstream from culvert on
US Route 15 (Frederick Freeway),1.1 mi northwest of Frederick, and 325 ft upstream of Rock Creek.
DRAINAGE AREA.--7.33 mi2, from automated delineation using 30-meter National Elevation Dataset, digital elevation model data, dated December 2011.
PERIOD OF RECORD.--October 2017 to current year.
GAGE.--Water-stage recorder, crest-stage gage and water-quality meter. Datum of gage is 291.33 ft above North American Vertical Datum of 1988.
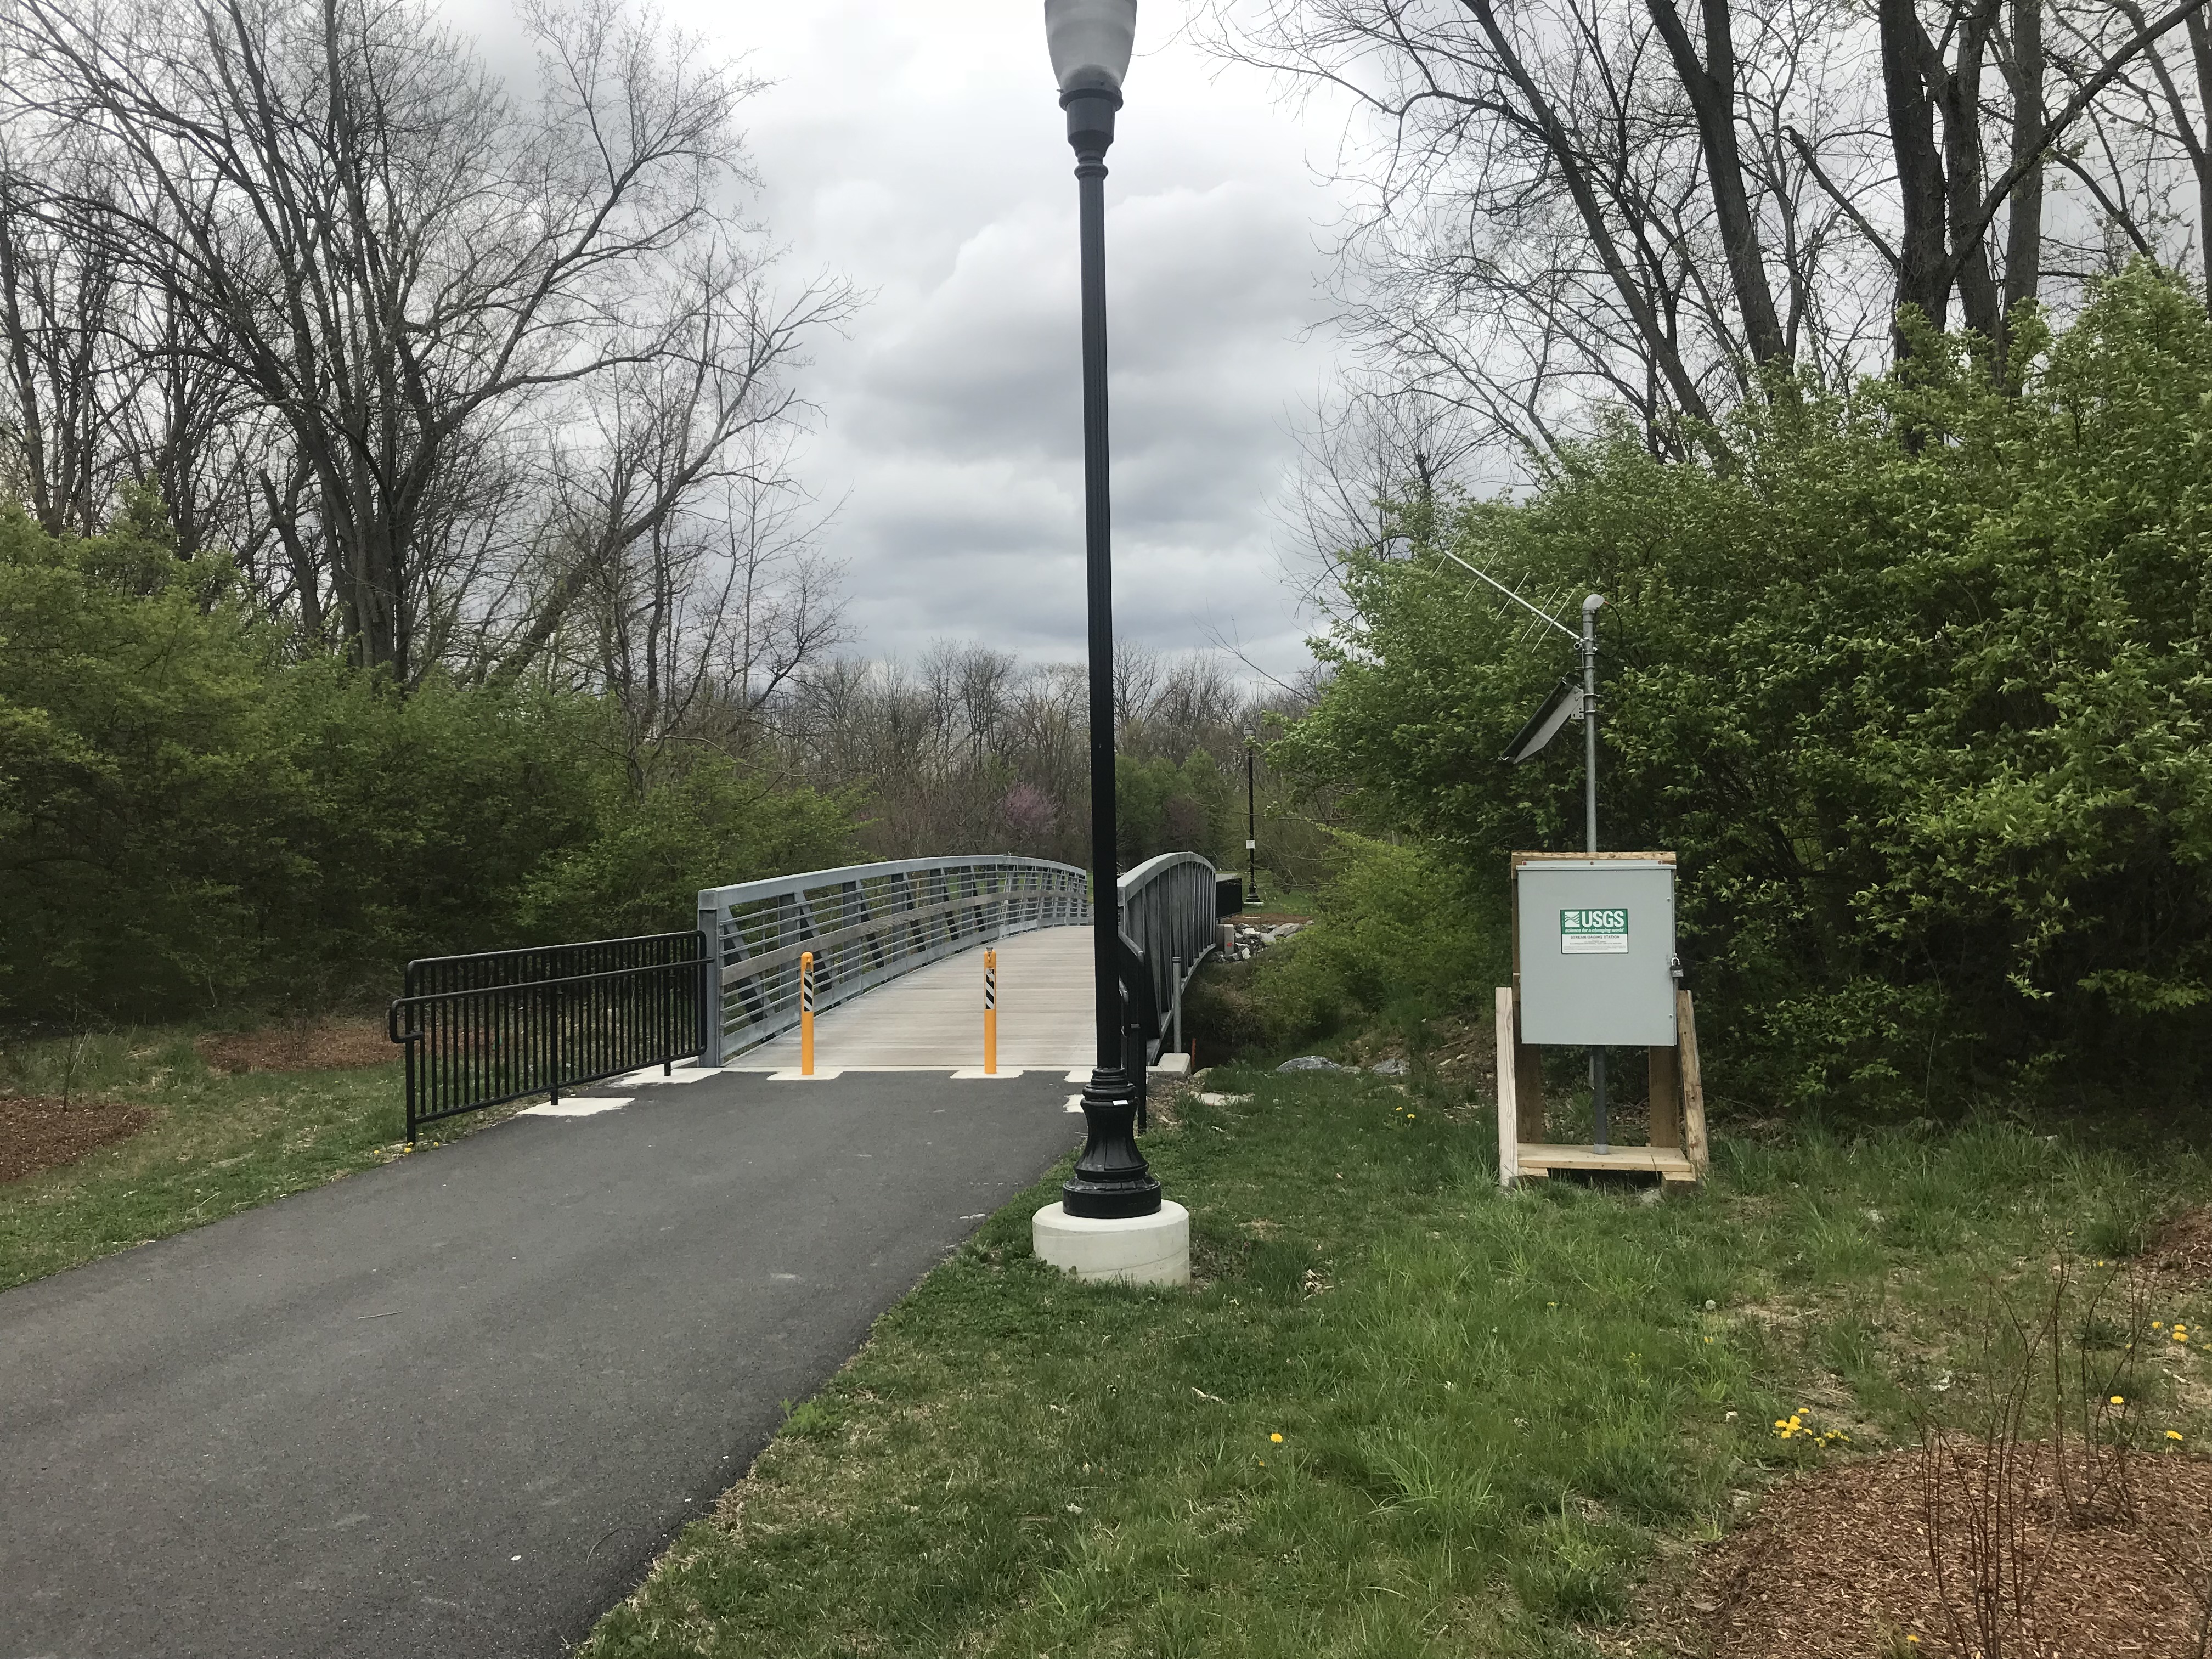
REMARKS.--U.S. Geological Survey satellite data-collection platform at station.
EXTREMES FOR PERIOD OF RECORD.--Maximum discharge, 3,290 ft³/s, Sept. 1, 2021, maximum gage height, 11.49 ft, July 8, 2019; minimum discharge, 2.01 ft³/s, Jan. 7, 2018.
COOPERATION.--Funding for the operation of this station is provided by the U.S. Army Environmental Command and the U.S. Geological Survey.
Summary of all available data for this site
Instantaneous-data availability statement