USGS 02320250 TROY SPRING NEAR BRANFORD FLA

PROVISIONAL DATA SUBJECT TO REVISION

Click to hidestation-specific text

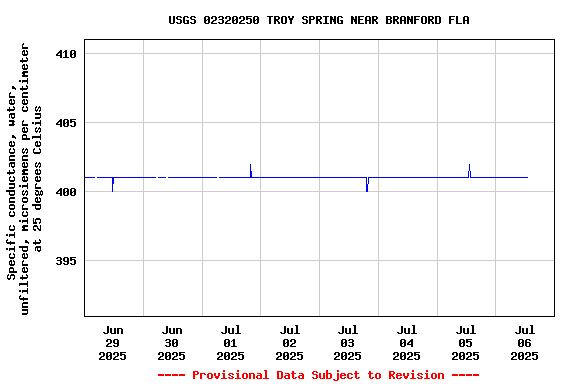
This gage is monitored in cooperation with the Suwannee River Water Management District.

Link to the Suwannee River Water Management District

During periods of higher water levels the Suwannee River backs up into the spring run. The water quality data collected during these periods is not representative of water coming from the spring, but the Suwannee River.
Available Parameters Available Period
  
2014-07-02  2024-03-28
2007-10-01  2024-03-28
2014-07-02  2024-03-28
2014-07-02  2024-03-28
2014-07-02  2024-03-28
2014-07-03  2024-03-28


 (7)
 

  -- or --


Summary of all available data for this site
Instantaneous-data availability statement


Temperature, water, degrees Celsius

Most recent instantaneous value: 19.9 03-28-2024   18:00 EDT
Graph of  Temperature, water, degrees Celsius

Add up to 2 more sites and replot for "Temperature, water, degrees Celsius"

?


Create presentation-quality / stand-alone graph.   Subscribe to WaterAlert      

See this graph on the Monitoring Location Pages


Specific conductance, water, unfiltered, microsiemens per centimeter at 25 degrees Celsius

Most recent instantaneous value: 183 03-28-2024   18:00 EDT
Graph of  Specific conductance, water, unfiltered, microsiemens per centimeter at 25 degrees Celsius

Add up to 2 more sites and replot for "Specific conductance, water, unfiltered, microsiemens per centimeter at 25 degrees Celsius"

?


Create presentation-quality / stand-alone graph.   Subscribe to WaterAlert      

See this graph on the Monitoring Location Pages


Dissolved oxygen, water, unfiltered, milligrams per liter

Most recent instantaneous value: 5.0 03-28-2024   18:00 EDT
Graph of  Dissolved oxygen, water, unfiltered, milligrams per liter

Add up to 2 more sites and replot for "Dissolved oxygen, water, unfiltered, milligrams per liter"

?


Create presentation-quality / stand-alone graph.   Subscribe to WaterAlert      

See this graph on the Monitoring Location Pages


pH, water, unfiltered, field, standard units

Most recent instantaneous value: 7.4 03-28-2024   18:00 EDT
Graph of  pH, water, unfiltered, field, standard units

Add up to 2 more sites and replot for "pH, water, unfiltered, field, standard units"

?


Create presentation-quality / stand-alone graph.   Subscribe to WaterAlert      

See this graph on the Monitoring Location Pages