USGS 05420400 MISSISSIPPI RIVER AT DAM 13 NEAR FULTON, IL

PROVISIONAL DATA SUBJECT TO REVISION

Click to hidestation-specific text

> Site Information

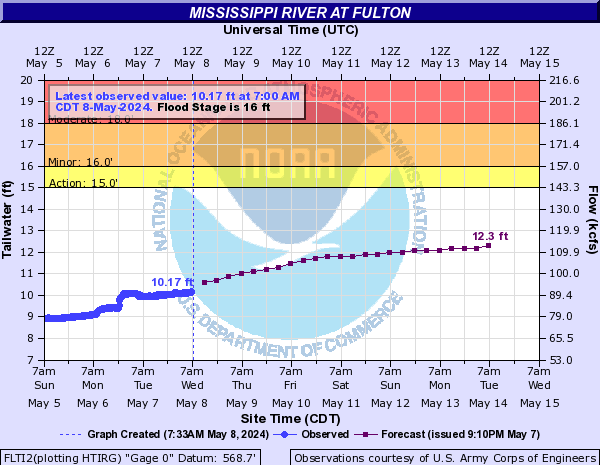
> National Weather Service River Forecast

Funding For This Site Provided By:

Link to Upstream Gage

Iowa WSC Gage Network

Link to Downstream Gage


Prior to Nov. 24, 2021, water quality sensors were located downstream at 05420500 Mississippi River at Clinton, IA.

Available Parameters Available Period
  
2021-11-24  2024-04-24
2023-12-26  2024-04-24
2021-11-24  2024-04-24
2021-11-24  2024-04-24
2021-11-24  2024-04-24
2021-11-24  2024-04-24
2023-12-26  2024-04-24
2021-11-24  2024-04-24
2021-11-24  2024-04-24


 (7)
 

  -- or --


Summary of all available data for this site
Instantaneous-data availability statement


Temperature, water, degrees Celsius

Most recent instantaneous value: 13.5 04-24-2024   19:15 CST
Graph of  Temperature, water, degrees Celsius

Add up to 2 more sites and replot for "Temperature, water, degrees Celsius"

?


Create presentation-quality / stand-alone graph.   Subscribe to WaterAlert      

See this graph on the Monitoring Location Pages


Specific conductance, water, unfiltered, microsiemens per centimeter at 25 degrees Celsius

Most recent instantaneous value: 432 04-24-2024   19:15 CST
Graph of  Specific conductance, water, unfiltered, microsiemens per centimeter at 25 degrees Celsius

Add up to 2 more sites and replot for "Specific conductance, water, unfiltered, microsiemens per centimeter at 25 degrees Celsius"

?


Create presentation-quality / stand-alone graph.   Subscribe to WaterAlert      

See this graph on the Monitoring Location Pages


Dissolved oxygen, water, unfiltered, milligrams per liter

Most recent instantaneous value: 13.8 04-24-2024   19:15 CST
Graph of  Dissolved oxygen, water, unfiltered, milligrams per liter

Add up to 2 more sites and replot for "Dissolved oxygen, water, unfiltered, milligrams per liter"

?


Create presentation-quality / stand-alone graph.   Subscribe to WaterAlert      

See this graph on the Monitoring Location Pages


pH, water, unfiltered, field, standard units

Most recent instantaneous value: 8.8 04-24-2024   19:15 CST
Graph of  pH, water, unfiltered, field, standard units

Add up to 2 more sites and replot for "pH, water, unfiltered, field, standard units"

?


Create presentation-quality / stand-alone graph.   Subscribe to WaterAlert      

See this graph on the Monitoring Location Pages