USGS 06465500 Niobrara River near Verdel, Nebr.

PROVISIONAL DATA SUBJECT TO REVISION

Click to hidestation-specific text
Funding for this site is provided by
logo logo
Omaha District National Streamflow
Information Program
> WaterNow – get the latest gage data from your mobile phone or email.

> Rating Information

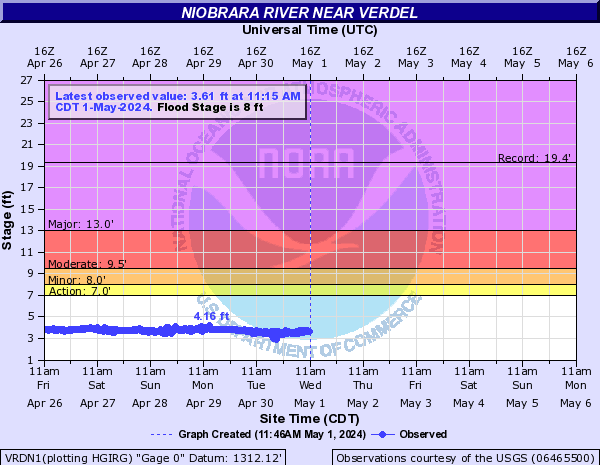
USGS gaging station: Niobrara River near Verdel, Nebr.

Upstream Niobrara River Basin

This station managed by the Lincoln Field Office.

Available Parameters Available Period
  
2010-10-11  2023-09-26
2023-08-01  2023-09-26
1990-10-06  2023-09-26
2007-10-01  2023-09-26
2014-03-26  2023-09-26
2014-03-26  2023-09-26
2014-03-26  2023-09-26


 (7)
 

  -- or --


Summary of all available data for this site
Instantaneous-data availability statement


Temperature, water, degrees Celsius

Most recent instantaneous value: 21.4 09-26-2023   19:15 CDT
Graph of  Temperature, water, degrees Celsius

Add up to 2 more sites and replot for "Temperature, water, degrees Celsius"

?


Create presentation-quality / stand-alone graph.   Subscribe to WaterAlert      

See this graph on the Monitoring Location Pages


Specific conductance, water, unfiltered, microsiemens per centimeter at 25 degrees Celsius, Qwmonitor

Most recent instantaneous value: 266 09-26-2023   19:15 CDT
Graph of  Specific conductance, water, unfiltered, microsiemens per centimeter at 25 degrees Celsius

Add up to 2 more sites and replot for "Specific conductance, water, unfiltered, microsiemens per centimeter at 25 degrees Celsius, Qwmonitor"

?


Create presentation-quality / stand-alone graph.   Subscribe to WaterAlert      

See this graph on the Monitoring Location Pages


Dissolved oxygen, water, unfiltered, milligrams per liter, Qwmonitor

Most recent instantaneous value: 8.4 09-26-2023   19:15 CDT
Graph of  Dissolved oxygen, water, unfiltered, milligrams per liter

Add up to 2 more sites and replot for "Dissolved oxygen, water, unfiltered, milligrams per liter, Qwmonitor"

?


Create presentation-quality / stand-alone graph.   Subscribe to WaterAlert      

See this graph on the Monitoring Location Pages


pH, water, unfiltered, field, standard units, Qwmonitor

Most recent instantaneous value: 8.2 09-26-2023   19:15 CDT
Graph of  pH, water, unfiltered, field, standard units

Add up to 2 more sites and replot for "pH, water, unfiltered, field, standard units, Qwmonitor"

?


Create presentation-quality / stand-alone graph.   Subscribe to WaterAlert      

See this graph on the Monitoring Location Pages