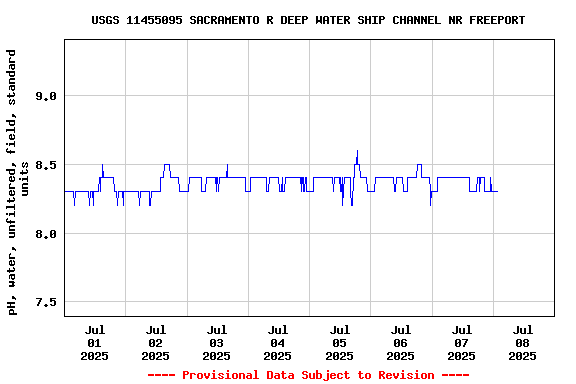
USGS 11455095 SACRAMENTO R DEEP WATER SHIP CHANNEL NR FREEPORT

PROVISIONAL DATA SUBJECT TO REVISION

Available Parameters Available Period
  
2018-07-11  2023-10-01
2020-10-01  2023-10-01
2020-10-01  2023-10-01
2018-07-11  2023-10-01
2018-07-11  2023-10-01
2023-06-03  2023-10-01
2018-07-11  2023-10-01
2020-10-01  2023-10-01
2020-10-01  2023-10-01
2018-07-11  2023-10-01
2020-10-01  2023-09-30
2020-10-01  2023-10-01
2023-06-03  2023-10-01
2020-10-01  2023-10-01


 (7)
 

  -- or --


Summary of all available data for this site
Instantaneous-data availability statement


Temperature, water, degrees Celsius

Most recent instantaneous value: 20.8 10-01-2023   19:45 PST
Graph of  Temperature, water, degrees Celsius

Add up to 2 more sites and replot for "Temperature, water, degrees Celsius"

?


Create presentation-quality / stand-alone graph.   Subscribe to WaterAlert      

See this graph on the Monitoring Location Pages


Specific conductance, water, unfiltered, microsiemens per centimeter at 25 degrees Celsius

Most recent instantaneous value: 686 10-01-2023   19:45 PST
Graph of  Specific conductance, water, unfiltered, microsiemens per centimeter at 25 degrees Celsius

Add up to 2 more sites and replot for "Specific conductance, water, unfiltered, microsiemens per centimeter at 25 degrees Celsius"

?


Create presentation-quality / stand-alone graph.   Subscribe to WaterAlert      

See this graph on the Monitoring Location Pages


Dissolved oxygen, water, unfiltered, milligrams per liter

Most recent instantaneous value: 8.3 10-01-2023   19:45 PST
Graph of  Dissolved oxygen, water, unfiltered, milligrams per liter

Add up to 2 more sites and replot for "Dissolved oxygen, water, unfiltered, milligrams per liter"

?


Create presentation-quality / stand-alone graph.   Subscribe to WaterAlert      

See this graph on the Monitoring Location Pages


pH, water, unfiltered, field, standard units

Most recent instantaneous value: 8.2 10-01-2023   19:45 PST
Graph of  pH, water, unfiltered, field, standard units

Add up to 2 more sites and replot for "pH, water, unfiltered, field, standard units"

?


Create presentation-quality / stand-alone graph.   Subscribe to WaterAlert      

See this graph on the Monitoring Location Pages