PROVISIONAL DATA SUBJECT TO REVISION
Click to hidestation-specific text
Funding for this site is provided by:
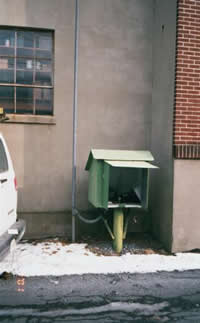 STATION.--402207076180801 LEBANON COUNTY, local well
number LB 372
STATION.--402207076180801 LEBANON COUNTY, local well
number LB 372LOCATION.--Lat 40`22'07.5", long 76`18'06.2", Hydrologic Unit 02040203, at Myerstown.
OWNER.--Privately owned.
AQUIFER.--Dolomite of Ontelaunee Formation of Middle Ordovician age.
WELL CHARACTERISTICS.--Drilled unused observation well, diameter 6 in. Well depth originally reported as 80 ft; soundings in June 1997 found the depth was 37 ft; casing information not available, open hole.
INSTRUMENTATION.--Data collection platform with 15-minute recording interval since April 2023; prior, 30-minute recording interval. Satellite telemetry at station.
DATUM.--Elevation of land surface is 442.8 ft above North American Vertical Datum of 1988, from survey. Measuring point: Top of plywood shelf, 2.7 ft above land-surface datum. Prior to Apr. 22, 1981, measuring point was 3.50 ft above land-surface datum.
REMARKS.--Daily maximum, minimum, and mean water levels since October 1994 are available from the District Office.
PERIOD OF RECORD.--July 1973 to current year.
COOPERATION.--Funding for the operation of this station is provided by the Pennsylvania Department of Environmental Protection and the U.S. Geological Survey.
Summary of all available data for this site
Instantaneous-data availability statement
