PROVISIONAL DATA SUBJECT TO REVISION
Click to hidestation-specific text
Funding for this site is provided by:
 Site Information
LOCATION.--Lat 41°28'46.0", long
74°47'02.9" referenced to North American Datum of
1983, Sullivan County, NY, Hydrologic Unit 02040104, near Glen
Spey.
WELL CHARACTERISTICS.--Depth 36 ft. Upper casing diameter 2 in; top of first opening 26.5 ft, bottom of last opening 36 ft.
DATUM.--Land-surface datum is 1,323 ft above North American Vertical Datum of 1988. Measuring point: PVC casing, 0.85 ft above land-surface datum, Apr. 27, 2018 to present; Steel casing, 1.04 ft above land-surface datum, Apr. 27, 2018 to present.
PERIOD OF RECORD.--April 2018 to current year.
GAGE.--Water-stage recorder--15 minute; periodic manual measurements by USGS personnel.
REMARKS.--Rapid drops in water levels that occur during low-water conditions when levels reach a depth of about 28 ft below land surface are probably due to dewatering of an upper water-bearing zone at that depth. Recorded water levels were below transducer July 22 to Aug. 2, 2018 and Oct. 8 to Nov. 1, 2019, record not used. Satellite water-level telemeter at station.
EXTREMES FOR PERIOD OF RECORD.--Highest water level, 3.56 ft below land-surface datum, Jan. 16, 2024; lowest water level recorded, 35.86 ft below land-surface datum, Oct. 8, 2019, and may have been lower when water levels were below transducer (see REMARKS).
 WaterAlert – get an
email or text (SMS) alert based on your chosen threshold.
WaterAlert – get an
email or text (SMS) alert based on your chosen threshold.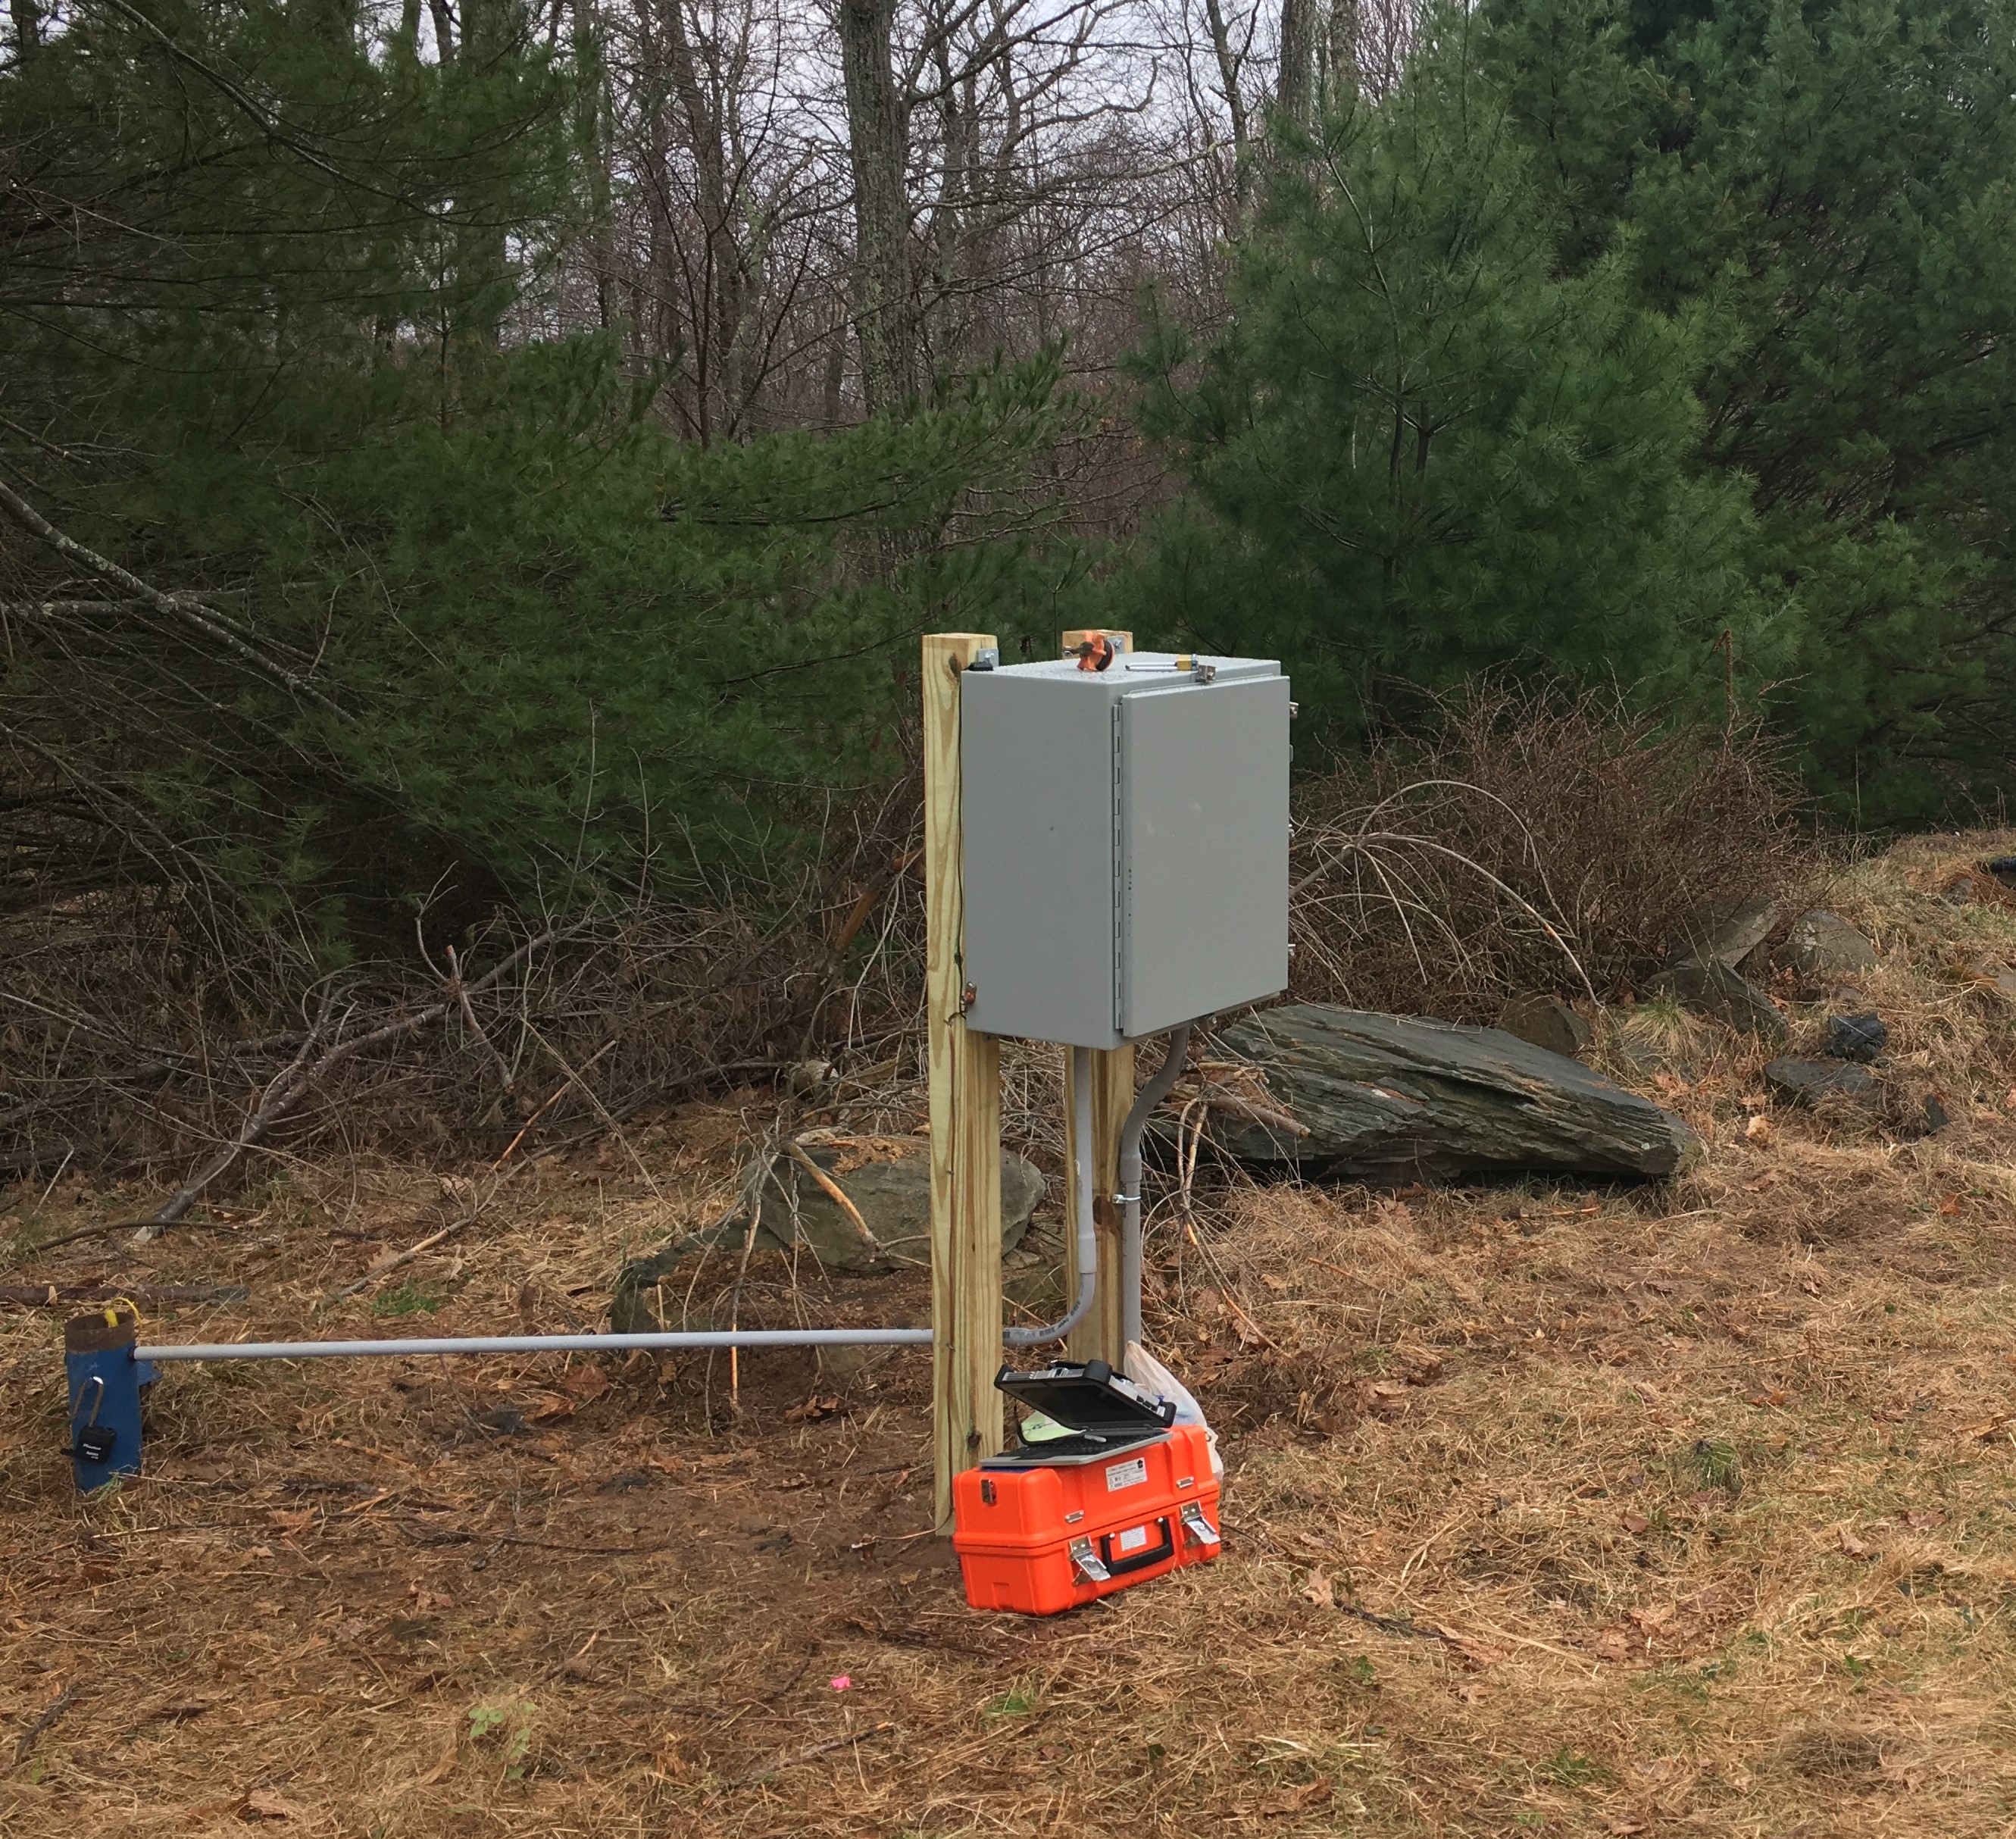 Station image
Summary of all available data for this site
Instantaneous-data availability statement
