PROVISIONAL DATA SUBJECT TO REVISION
Click to hidestation-specific text
Funding for this site is provided by:
 Site Information
LOCATION.--Lat 41°41'28.8", long
73°47'51.4" referenced to North American Datum of
1983, Dutchess County, NY, Hydrologic Unit 02020008, in James
Baird State Park, near Pleasant Valley.
WELL CHARACTERISTICS.--Depth 24.5 ft. Upper casing diameter 2.5 in; top of first opening 24.5 ft, bottom of last opening 27 ft. Well filled in from original depth of 27 ft, cased to 24.5 ft, 1.25-in. well point (60-gauze screen 24.5 ft to 27 ft, damaged during well installation).
DATUM.--Land-surface datum is 337.08 ft above North American Vertical Datum of 1988. Measuring point: Top of casing, 2.11 ft above land-surface datum, Jul. 13, 2005 to present; Top of extended casing, 2.94 ft above land-surface datum, Jul. 13, 2005 to present.
PERIOD OF RECORD.--October 1965 to April 1969, June 1971 to July 1989, December 1991 to September 1993, March 1999 to current year.
GAGE.--Water-stage recorder--15 minute; periodic manual measurements by USGS personnel. Prior to March 19, 2002, tape measurement by observer.
REMARKS.--Satellite water-level telemeter at station.
EXTREMES FOR PERIOD OF RECORD.--Highest water level, 10.48 ft below land-surface datum, Feb. 3, 1988; lowest water level, 20.60 ft below land-surface datum, Nov. 24, 1965.
 WaterAlert – get an
email or text (SMS) alert based on your chosen threshold.
WaterAlert – get an
email or text (SMS) alert based on your chosen threshold.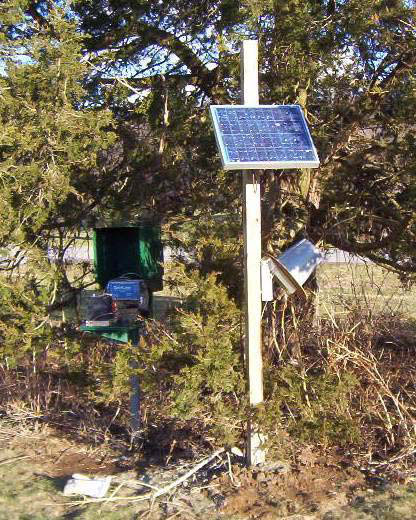 Station image
Summary of all available data for this site
Instantaneous-data availability statement
