PROVISIONAL DATA SUBJECT TO REVISION
Click to hidestation-specific text
Funding for this site is provided by:
 Site Information
LOCATION.--Lat 42°35'30.6", long
74°19'17.0" referenced to North American Datum of
1983, Schoharie County, NY, Hydrologic Unit 02020005, at
Middleburgh.
WELL CHARACTERISTICS.--Depth 19.5 ft. Upper casing diameter 2 in; top of first opening 4.9 ft, bottom of last opening 14.7 ft. Cased to 4.9 ft (screen, 4.9 ft to 14.7 ft).
DATUM.--Land-surface datum is 737.96 ft above North American Vertical Datum of 1988. Measuring point: Top of casing, 3.99 ft above land-surface datum, Aug. 5, 2015 to Oct. 4, 2021; Top of casing, 4.0 ft above land-surface datum, Oct. 4, 2021 to present.
PERIOD OF RECORD.--April 2006 to current year.
REVISIONS HISTORY.--Groundwater levels for the period Aug. 9, 2016 at 11:00 to Nov. 30, 2016 at 11:00 were revised on Mar. 20, 2018, because a correction was applied incorrectly.
GAGE.--Water-stage recorder--15 minute; periodic manual measurements by USGS personnel.
REMARKS.--Satellite water-level telemeter at station.
EXTREMES FOR PERIOD OF RECORD.--Highest water level recorded, 3.65 ft below land-surface datum, Aug. 29, 2011; lowest water level recorded, 9.93 ft below land-surface datum, Sept. 29, 30, Oct. 1, 2010.
 WaterAlert – get an
email or text (SMS) alert based on your chosen threshold.
WaterAlert – get an
email or text (SMS) alert based on your chosen threshold.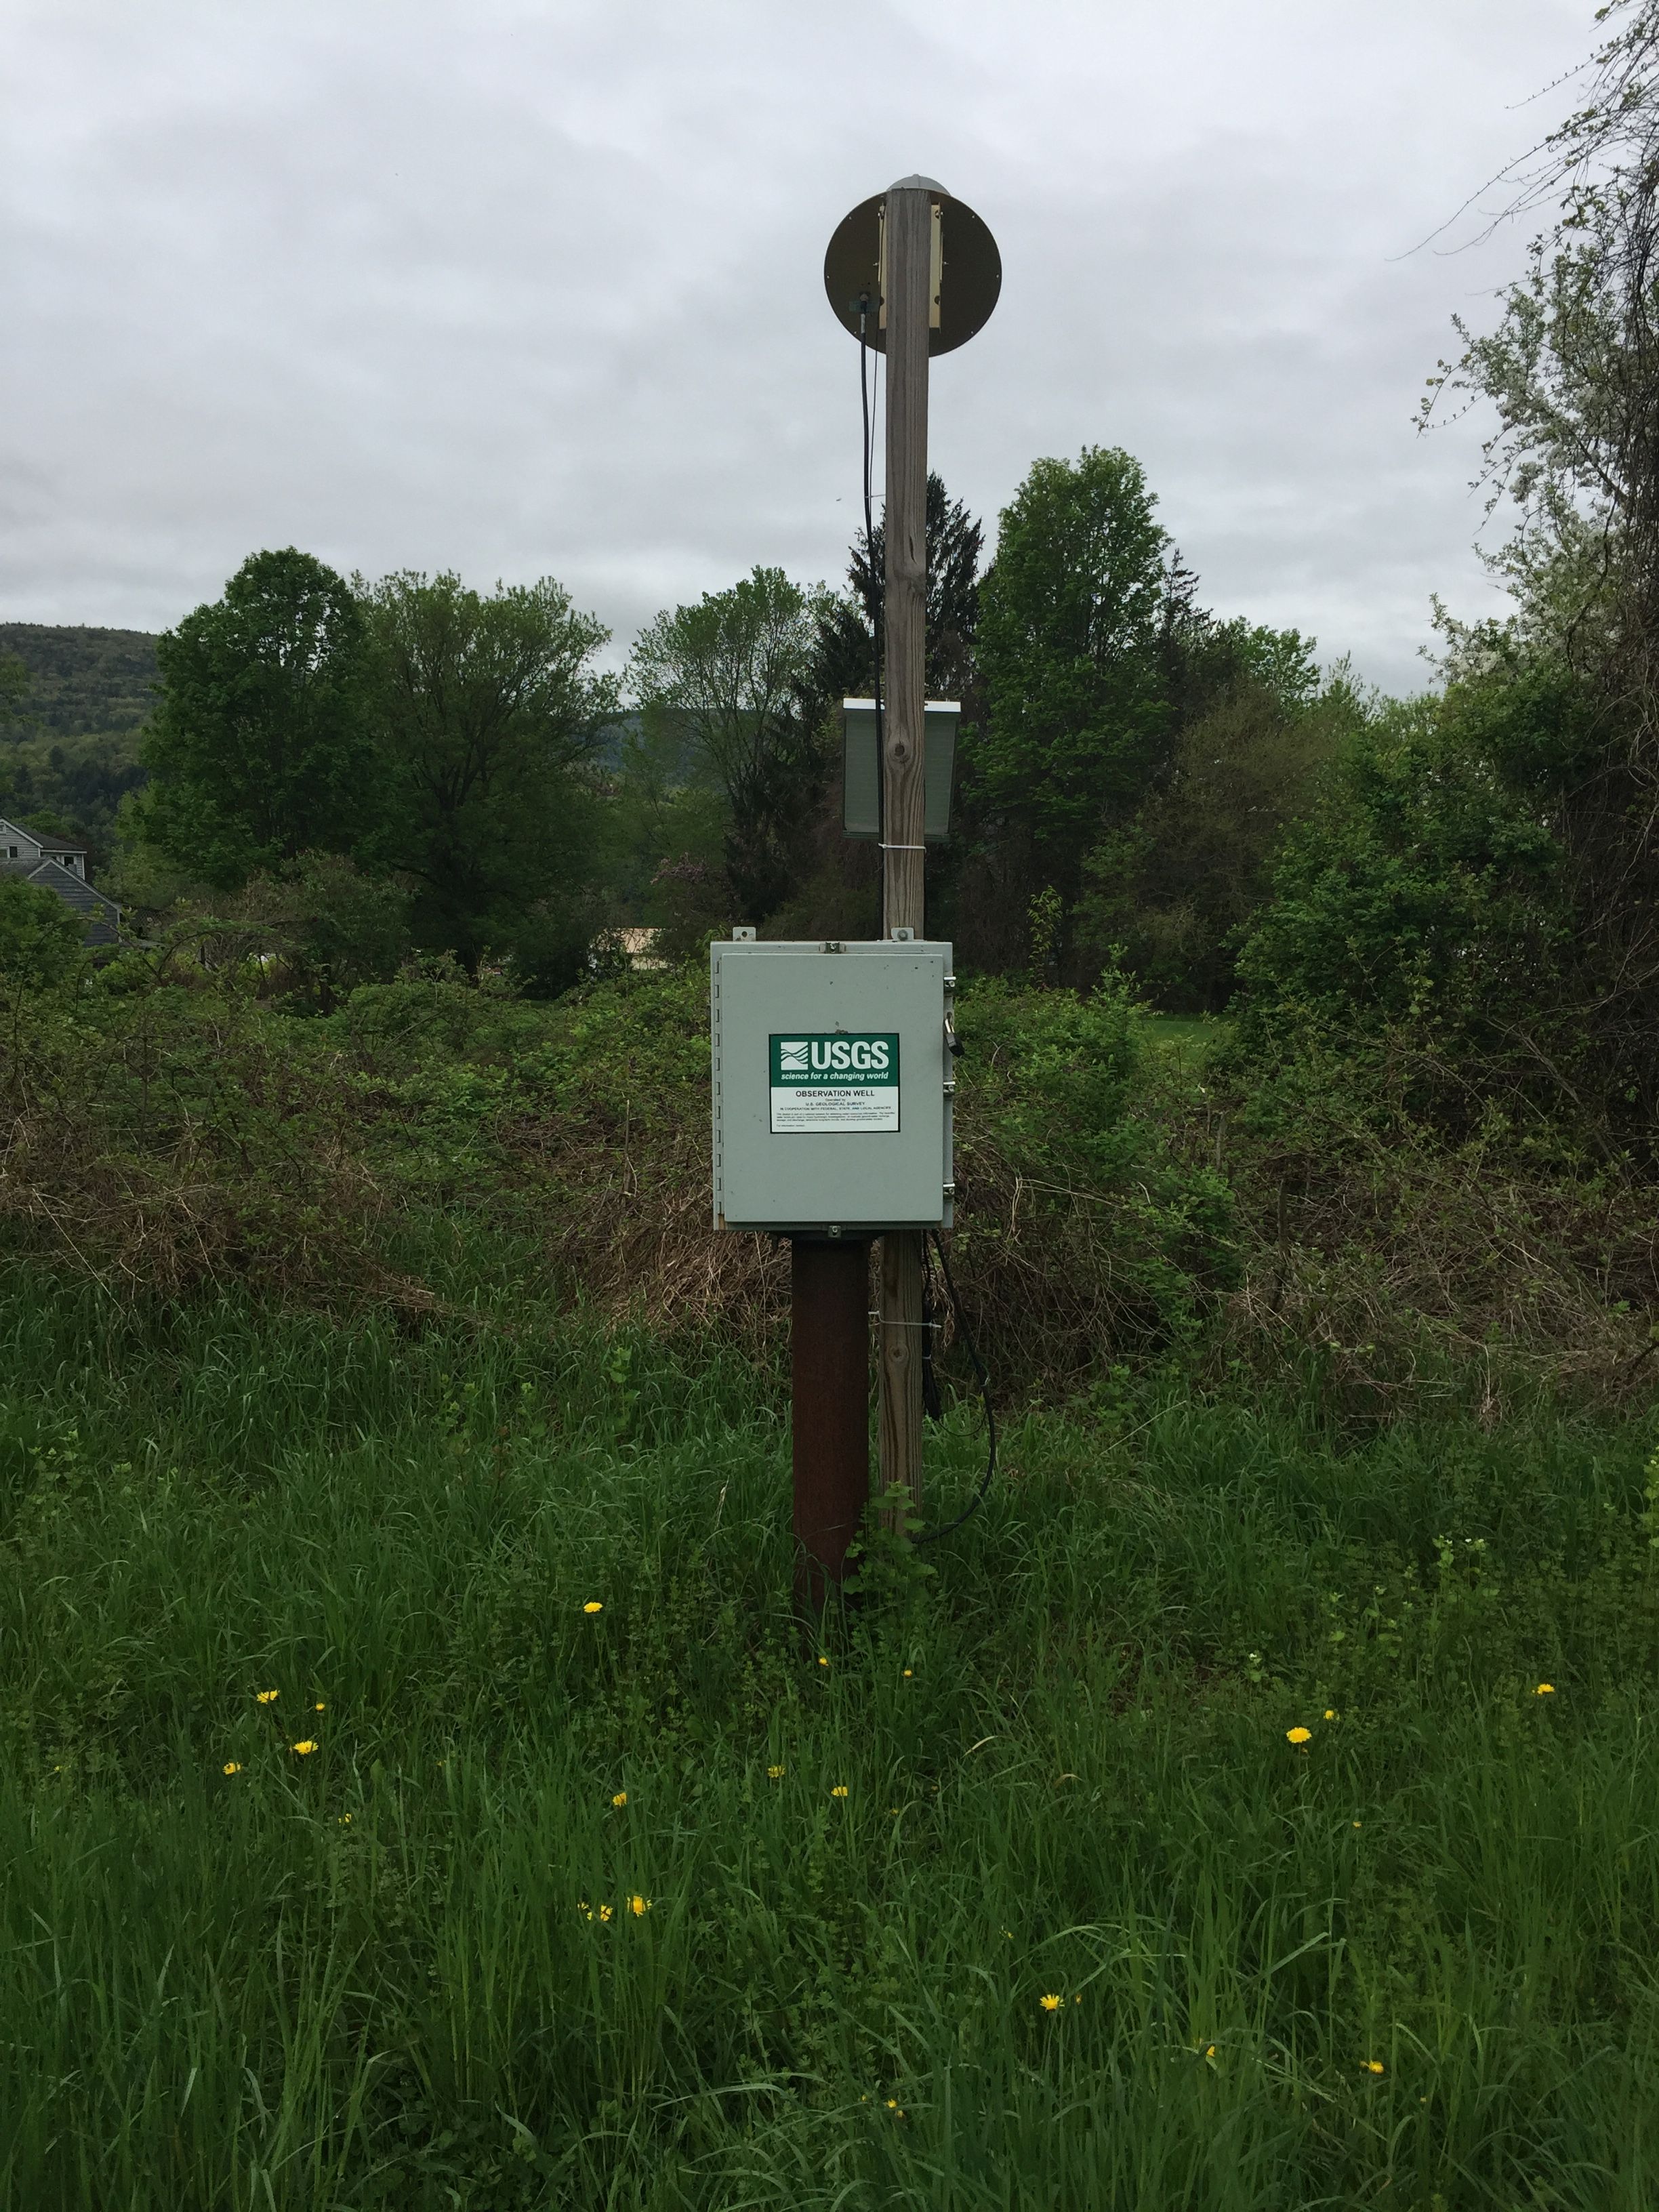 Station image
Summary of all available data for this site
Instantaneous-data availability statement
