PROVISIONAL DATA SUBJECT TO REVISION
Click to hidestation-specific text
Funding for this site is provided by:
 Site Information
LOCATION.--Lat 42°50'47.0", long
73°47'26.9" referenced to North American Datum of
1983, Saratoga County, NY, Hydrologic Unit 02020004, at Clifton
Park.
WELL CHARACTERISTICS.--Depth 14 ft. Upper casing diameter 2 in; top of first opening 10.2 ft, bottom of last opening 15.2 ft. Well filled in from original depth of 15.2 ft, cased to 10.2 ft (screen, 10.2 ft to 15.2 ft).
DATUM.--Land-surface datum is 295.81 ft above North American Vertical Datum of 1988. Measuring point: Top of extended 2 inch PVC casing, 4.27 ft above land-surface datum, Apr. 27, 2016 to Oct. 21, 2019; Top of extended 2 inch PVC casing, 4.28 ft above land-surface datum, Oct. 21, 2019 to present.
PERIOD OF RECORD.--July 1994, May 1996 to March 1998, December 2002 to current year.
GAGE.--Water-stage recorder--15 minute; periodic manual measurements by USGS personnel. Prior to December 2002, calibrated pressure gage.
REMARKS.--Levels were processed June 2009, showing a .16 ft change in the measuring point. A -.01 ft to -.14 ft correction was prorated and applied for Nov. 23, 2004 through Sept. 30, 2008 to correct the water level data. This prorated correction should be applied to the values published in Volume 1 of the Water Resources Data reports for those water years. The values presented on USGS web pages have been corrected. Satellite water-level telemeter at station.
EXTREMES FOR PERIOD OF RECORD.--Highest water level, 0.63 ft above land-surface datum, Mar. 12, 2011; lowest water level, 7.07 ft below land-surface datum, Oct. 25, 1997.
 WaterAlert – get an
email or text (SMS) alert based on your chosen threshold.
WaterAlert – get an
email or text (SMS) alert based on your chosen threshold.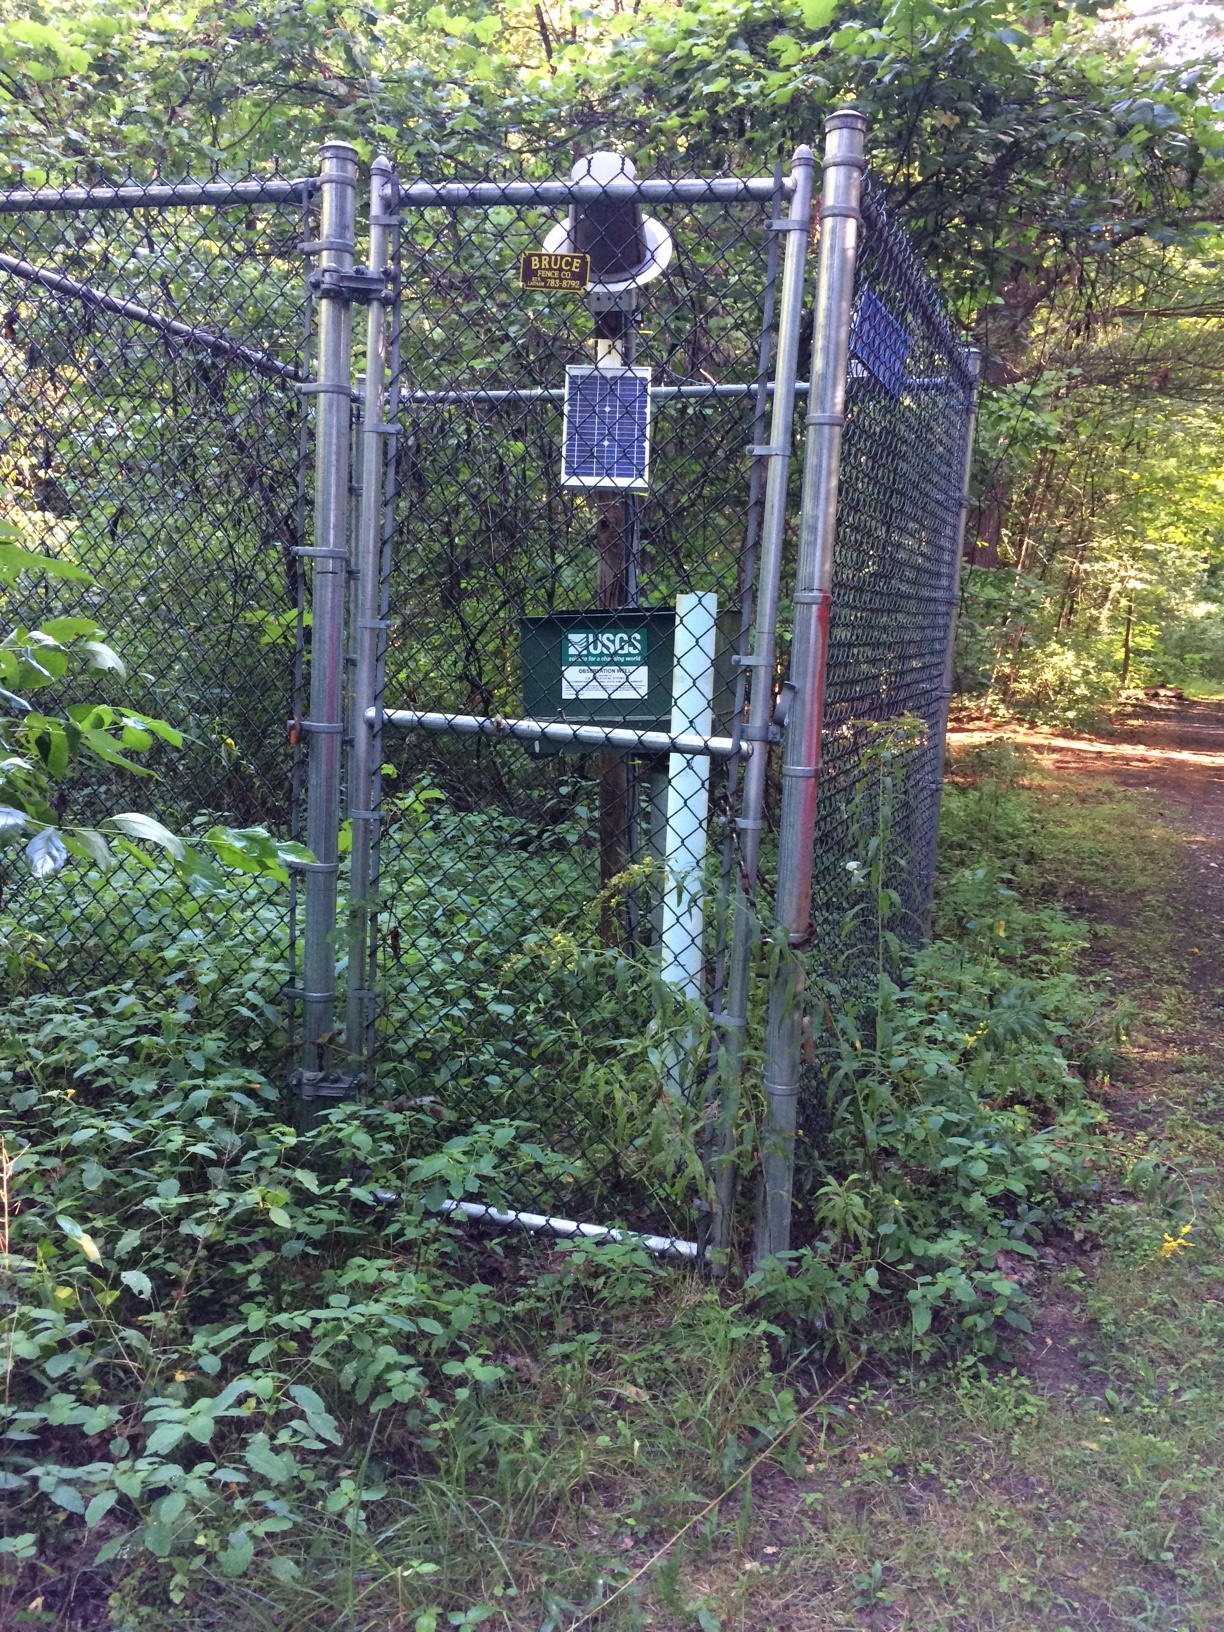 Station image
Summary of all available data for this site
Instantaneous-data availability statement
