PROVISIONAL DATA SUBJECT TO REVISION
Click to hidestation-specific text
Funding for this site is provided by:
 Site Information
LOCATION.--Lat 43°02'43.4", long
76°18'04.7" referenced to North American Datum of
1983, Onondaga County, NY, Hydrologic Unit 04140201, behind
Town of Camillus Department of Public Works buildings, near
Camillus.
WELL CHARACTERISTICS.--Depth 160 ft. Upper casing diameter 1 in; top of first opening 140 ft, bottom of last opening 160 ft. Cased to 160 ft (screen, 140 ft to 160 ft).
DATUM.--Land-surface datum is 411.5 ft above North American Vertical Datum of 1988. Measuring point: Top of shelter shelf, 2.88 ft above land-surface datum, May 26, 2016 to Jul. 29, 2021; Top of shelter shelf, 2.36 ft above land-surface datum, Jul. 29, 2021 to Jun. 28, 2022; Top of shelter shelf, 2.38 ft above land-surface datum, Jun. 28, 2022 to present.
PERIOD OF RECORD.--October 2004 to current year.
REVISIONS HISTORY.--Groundwater levels for the period July 29, 2021, to Sept. 30, 2021, were revised on Apr. 15, 2022, because recorded data was incorrect.
GAGE.--Water-stage recorder--15 minute; periodic measurements by USGS personnel.
REMARKS.--Satellite water-level telemeter at station.
EXTREMES FOR PERIOD OF RECORD.--Highest water level, 7.36 ft below land-surface datum, Apr. 3, 2005; lowest water level, 15.64 ft below land-surface datum, Oct. 13, 2024.
 WaterAlert – get an
email or text (SMS) alert based on your chosen threshold.
WaterAlert – get an
email or text (SMS) alert based on your chosen threshold.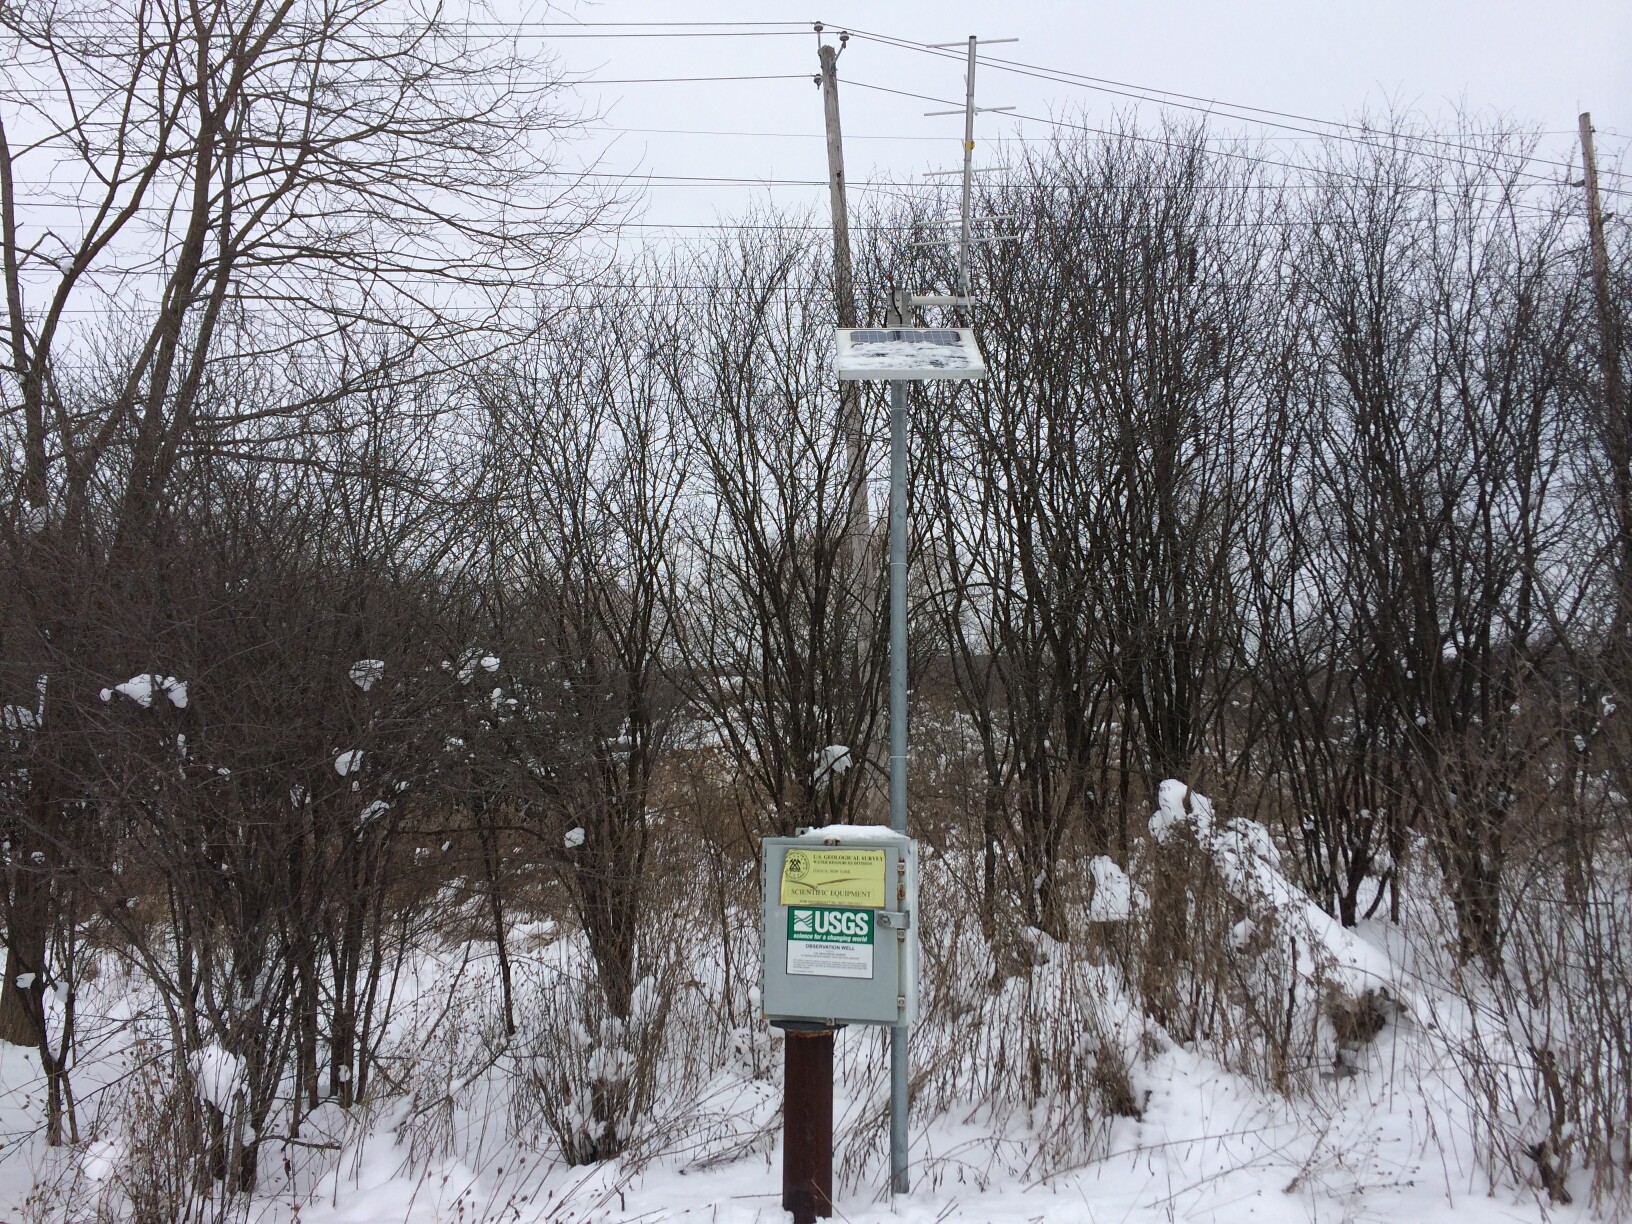 Station image
Instantaneous-data availability statement
