PROVISIONAL DATA SUBJECT TO REVISION
Click to hidestation-specific text
Funding for this site is provided by:
 Site Information
LOCATION.--Lat 43°02'52.8", long
77°28'32.7" referenced to North American Datum of
1983, Monroe County, NY, Hydrologic Unit 04140101, next to
intermittent stream south of Park Road, northeast of fish
hatchery ponds, at Powder Mill Park near Bushnell Basin.
WELL CHARACTERISTICS.--Depth 14.5 ft. Upper casing diameter 2 in; top of first opening 6 ft, bottom of last opening 16 ft. Well filled in from original depth of 16 ft, cased to 6 ft (screen, 6 ft to 16 ft). Elevation of land-surface datum is 448.66 ft above NGVD of 1929 and 447.80 ft above NAVD of 1988.
DATUM.--Land-surface datum is 447.8 ft above North American Vertical Datum of 1988. Measuring point: Top of extended casing, 2.95 ft above land-surface datum, Jun. 13, 2016 to Aug. 25, 2021; Top of extended casing, 2.97 ft above land-surface datum, Aug. 25, 2021 to present.
PERIOD OF RECORD.--December 1983 to September 1993, December 2003 to current year.
GAGE.--Water-stage recorder--15 minute; periodic measurements by USGS personnel.
REMARKS.--Water level is affected by nearby pumping. Satellite water-level telemeter at station.
EXTREMES FOR PERIOD OF RECORD.--Highest water level, 6.72 ft below land-surface datum, Apr. 3, 2005; lowest water level, 10.93 ft below land-surface datum, Nov. 10, 2024.
 WaterAlert – get an
email or text (SMS) alert based on your chosen threshold.
WaterAlert – get an
email or text (SMS) alert based on your chosen threshold.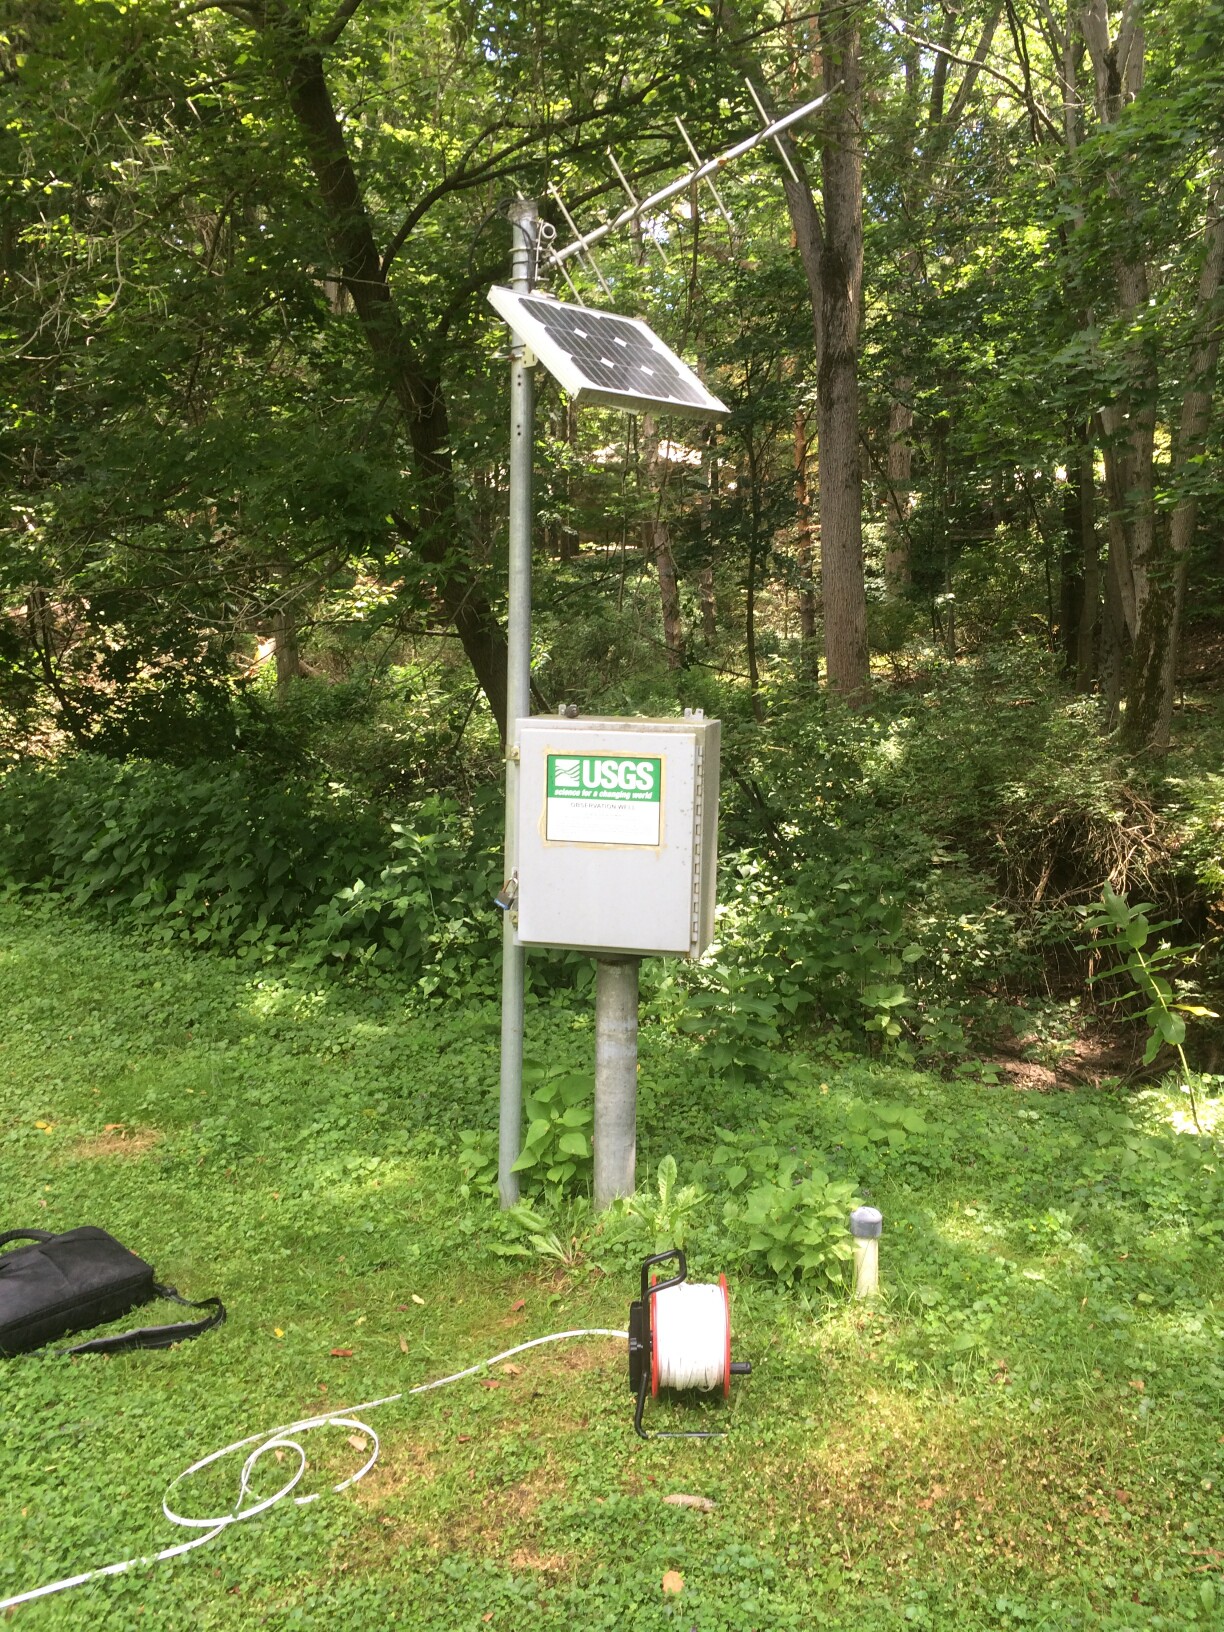 Station image
Summary of all available data for this site
Instantaneous-data availability statement
