PROVISIONAL DATA SUBJECT TO REVISION
Click to hidestation-specific text
Funding for this site is provided by:
 Site Information
LOCATION.--Lat 41°45'38.0", long
75°02'54.2" referenced to North American Datum of
1983, Sullivan County, NY, Hydrologic Unit 02040101, on right
bank 0.7 mi southeast of Callicoon, 0.9 mi upstream from mouth,
and 1.0 mi southwest of Hortonville.
DRAINAGE AREA.--110 mi².
PERIOD OF RECORD.--October 1940 to September 1982, October 2018 to current year. Annual maximum only--1987-99. Discharge measurements only--2000-11, 2013-15. Gage heights only--September 2001 to September 2017 (unpublished) and October 2017 to September 2018.
GAGE.--Water-stage recorder and crest-stage gage. Datum of gage is 759.84 ft above NGVD of 1929 and 759.30 ft above NAVD of 1988.
REMARKS.--Water Years 2019-21: Records good except those for estimated daily discharges, which are poor. Water Years 2022-24: Records fair except those for estimated daily discharges and discharges above 6,000 ft³/s, which are poor.
EXTREMES FOR PERIOD OF RECORD.--Maximum discharge, 16,000 ft³/s, Aug. 17, 1947, gage height, 9.68 ft in gage well, 10.6 ft, from flood profile from floodmarks, from rating curve extended above 5,100 ft³/s on basis of slope-area measurement of peak flow; minimum, 4.0 ft³/s, July 26, 27, 1965.
PERIOD OF DAILY RECORD1.--WATER TEMPERATURE: May 2019 to current year.
INSTRUMENTATION1.--Water-temperature recorder provides 15-minute-interval readings.
EXTREMES FOR PERIOD OF DAILY RECORD1.--Maximum, 29.6 °C, June 30, 2021; minimum, -0.1 °C on several days during the 2021 water year winter period, Feb. 15, 2024.
1 Water-Quality Records
 WaterAlert – get an
email or text (SMS) alert based on your chosen threshold.
WaterAlert – get an
email or text (SMS) alert based on your chosen threshold.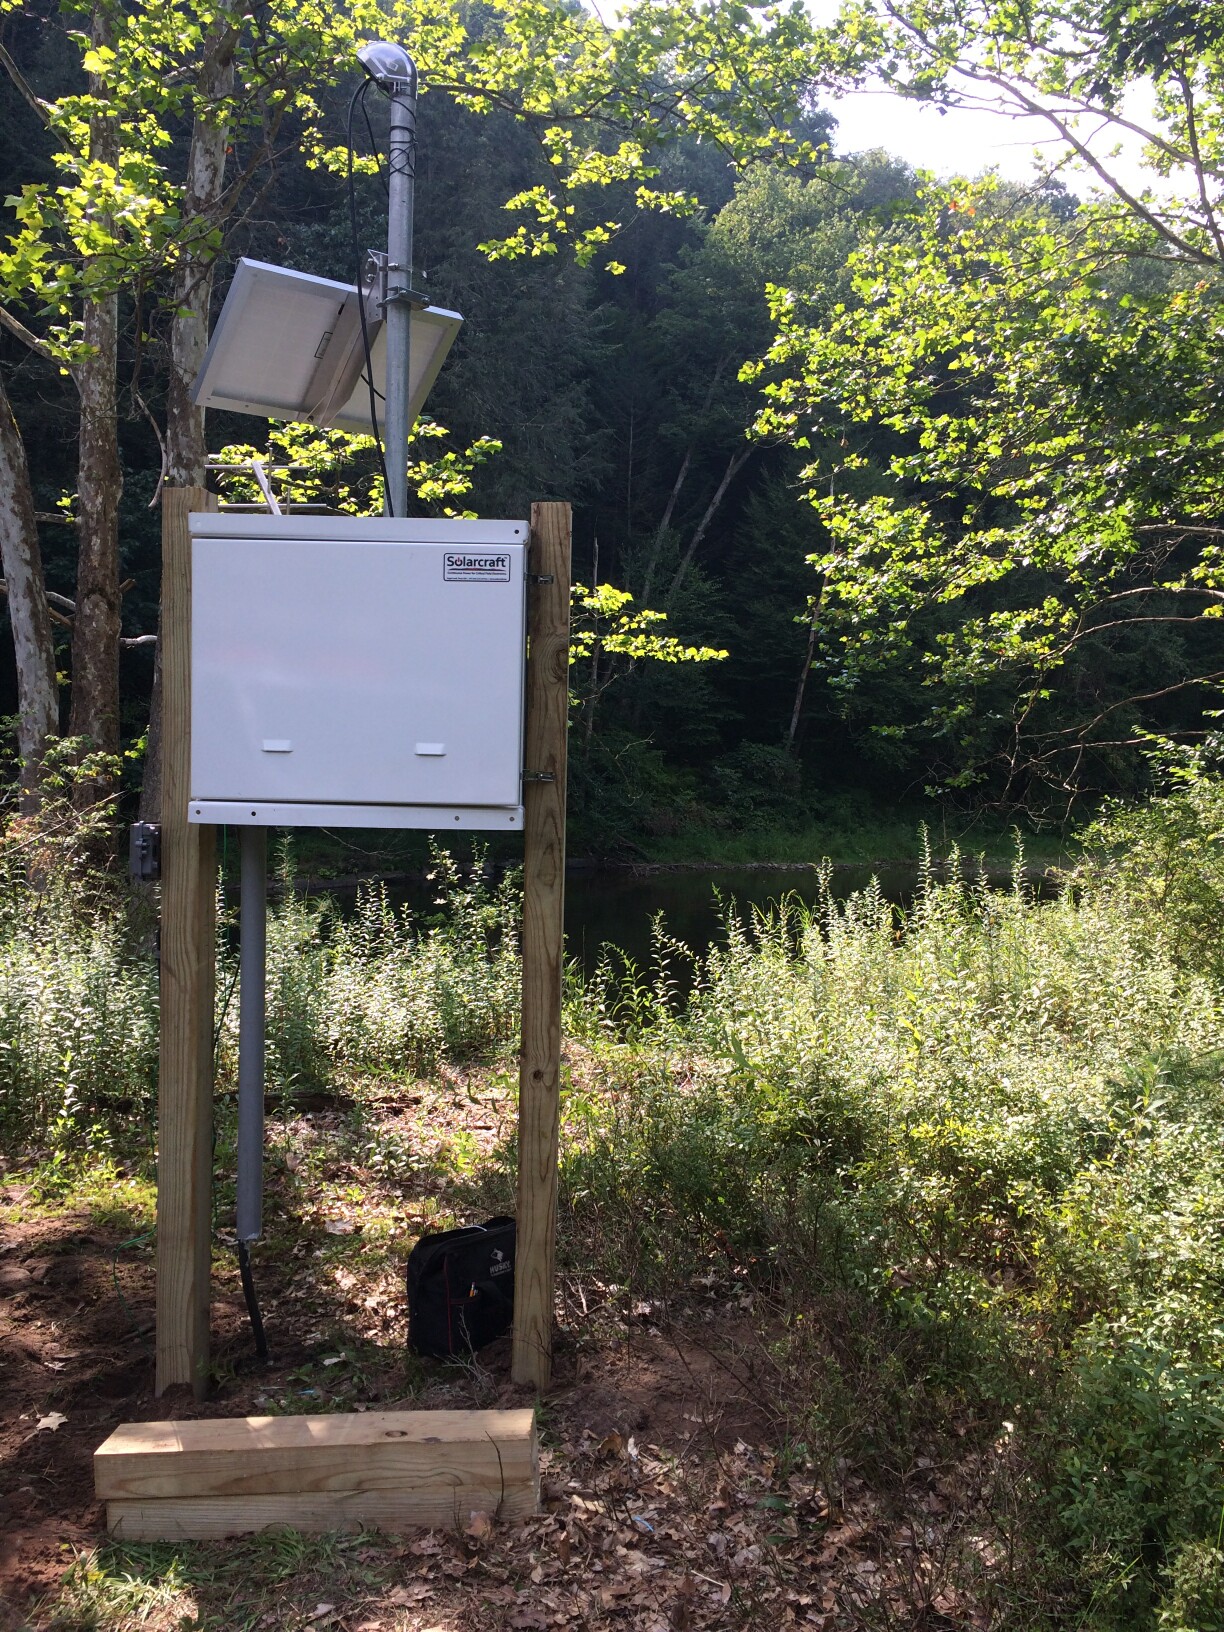 Station image
Summary of all available data for this site
Instantaneous-data availability statement


