USGS 01446775 Bushkill Creek ab Rt 33 bridge at Tatamy, PA

PROVISIONAL DATA SUBJECT TO REVISION

Click to hidestation-specific text
Funding for this site is provided by:


Station gage image
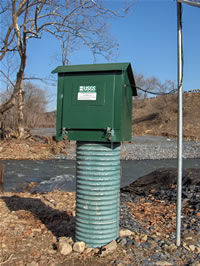
STATION.--01446775 BUSHKILL CREEK ABOVE RT 33 BRIDGE AT TATAMY, PA
LOCATION.--Lat 40`44'56", long 75`15'56", Northampton County, Hydrologic Unit 02040105, on right bank, 100 ft upstream of Route 33 bridge at Tatamy.
DRAINAGE AREA.--31.1 square miles.
PERIOD OF RECORD.--November 2005 to current year.
GAGE.--Water-stage recorder and crest-stage gage. Datum of gage is 331.775 ft above North American Vertical Datum of 1988, from GNSS Level II RTN Survey. Satellite telemetry at station.
COOPERATION.--Station established and maintained by the U.S. Geological Survey in cooperation with Hercules Cement Company, Inc.
REMARKS.--Water is pumped from the Hercules quarry 0.25 miles upstream.
GAGE HEIGHTS OF IMPORTANCE.--
Supplied by USGS:Maximum recordable gage height (stage operational limit) - 15.7 ft;
This station managed by the PAWSC New Cumberland Office.

Available Parameters Available Period
  
2005-11-29  2024-04-18
2007-10-01  2024-04-18


 (7)
 

  -- or --


Summary of all available data for this site
Instantaneous-data availability statement


Discharge, cubic feet per second

Most recent instantaneous value: 58.2 04-18-2024   21:15 EDT
Graph of  Discharge, cubic feet per second

Add up to 2 more sites and replot for "Discharge, cubic feet per second"

?


Create presentation-quality / stand-alone graph.   Subscribe to WaterAlert      

See this graph on the Monitoring Location Pages


Daily discharge, cubic feet per second -- statistics for Apr 18 based on 18 water years of record more
Most Recent
Instantaneous
Value Apr 18
Min
(2006)
25th
percen-
tile
Median Mean 75th
percen-
tile
Max
(2011)
58.2 103 117 139 167 227 291


Gage height, feet

Most recent instantaneous value: 7.97 04-18-2024   21:15 EDT
Graph of  Gage height, feet

Add up to 2 more sites and replot for "Gage height, feet"

?


Create presentation-quality / stand-alone graph.   Subscribe to WaterAlert      

See this graph on the Monitoring Location Pages