PROVISIONAL DATA SUBJECT TO REVISION
Click to hidestation-specific text
Funding for this site is provided by:
 Site Information
LOCATION.--Lat 44°54'08", long
73°24'54" referenced to North American Datum of 1983,
Clinton County, NY, Hydrologic Unit 04150408, on right bank at
downstream side of bridge on Stetson Road, 0.2 mi upstream from
abandoned dam, 1.4 mi northeast of Chazy, and 2.2 mi upstream
from mouth.
DRAINAGE AREA.--50.3 mi².
PERIOD OF RECORD.--March 1990 to September 2014, October 2015 to current year.
GAGE.--Water-stage recorder and crest-stage gage. Datum of gage is 106.22 ft above NGVD of 1929 (corrected) and 105.83 ft above NAVD of 1988.
REMARKS.--Some regulation at low flow by dams and reservoirs upstream from station.
Water Years 2014, 2016-24: Records fair except those for estimated daily discharges, which are poor.
EXTREMES FOR PERIOD OF RECORD.--Maximum discharge, 2,750 ft³/s, Nov. 10, 1996, gage height, 10.40 ft, outside gage height was 11.12 ft, from crest-stage gage; minimum discharge, 0.42 ft³/s, Sept. 7, 8, 1991, Sept. 2, 3, 2018; minimum gage height, 1.15 ft, Sept. 2, 3, 2018.
 WaterAlert – get an
email or text (SMS) alert based on your chosen threshold.
WaterAlert – get an
email or text (SMS) alert based on your chosen threshold.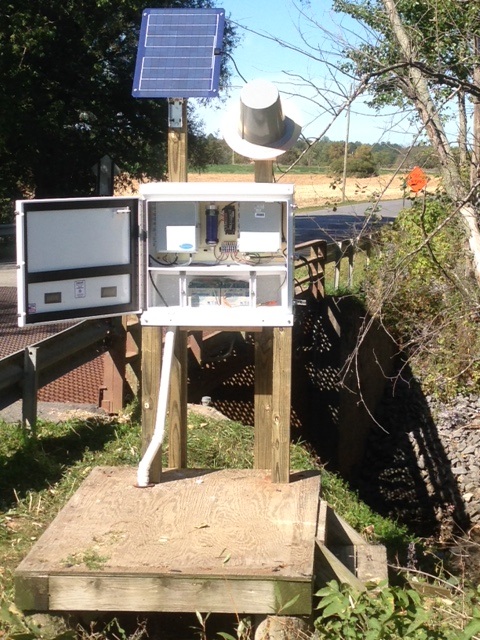 Station image
Summary of all available data for this site
Instantaneous-data availability statement

