USGS 06796500 Platte River near Leshara, Nebr.

PROVISIONAL DATA SUBJECT TO REVISION

Click to hidestation-specific text
> WaterNow – get the latest gage data from your mobile phone or email.

> Rating Information

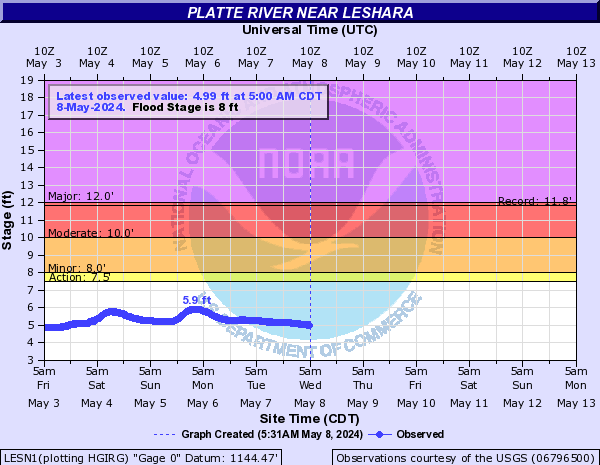
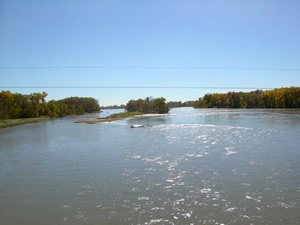
Downstream view from USGS gaging station: Platte River near Leshara, Nebr.

Upstream Platte River Basin
(Loup River-Elkhorn River)
Downstream

This station managed by the Lincoln Field Office.

Available Parameters Available Period
  
2016-04-08  2025-07-12
1994-06-30  2025-07-12
2007-10-01  2025-07-12
2016-04-09  2025-07-12
2016-04-08  2025-07-12
2016-04-07  2025-07-12
2016-06-02  2025-07-12
2016-04-08  2025-07-12


 (7)
 

  -- or --


Summary of all available data for this site
Instantaneous-data availability statement


Temperature, water, degrees Celsius

Most recent instantaneous value: 24.9 07-12-2025   03:00 CDT
Graph of  Temperature, water, degrees Celsius

Add up to 2 more sites and replot for "Temperature, water, degrees Celsius"

?


Create presentation-quality / stand-alone graph.   Subscribe to WaterAlert      

See this graph on the Monitoring Location Pages


Discharge, cubic feet per second, [Discharge from Primary Sensor]

Most recent instantaneous value: 5800 07-12-2025   03:00 CDT
Graph of  Discharge, cubic feet per second, [Discharge from Primary Sensor]

Add up to 2 more sites and replot for "Discharge, cubic feet per second, [Discharge from Primary Sensor]"

?


Create presentation-quality / stand-alone graph.   Subscribe to WaterAlert      

See this graph on the Monitoring Location Pages


Daily discharge, cubic feet per second -- statistics for Jul 12 based on 31 water years of record more
Min
(2012)
25th
percen-
tile
Median Mean Most Recent
Instantaneous
Value Jul 12
75th
percen-
tile
Max
(2019)
601 1840 4370 5120 5800 6020 20600


Gage height, feet, [Primary Stage Sensor]

Most recent instantaneous value: 4.68 07-12-2025   03:00 CDT
Graph of  Gage height, feet, [Primary Stage Sensor]

Add up to 2 more sites and replot for "Gage height, feet, [Primary Stage Sensor]"

?


Create presentation-quality / stand-alone graph.   Subscribe to WaterAlert      

See this graph on the Monitoring Location Pages


Specific conductance, water, unfiltered, microsiemens per centimeter at 25 degrees Celsius

Most recent instantaneous value: 345 07-12-2025   03:00 CDT
Graph of  Specific conductance, water, unfiltered, microsiemens per centimeter at 25 degrees Celsius

Add up to 2 more sites and replot for "Specific conductance, water, unfiltered, microsiemens per centimeter at 25 degrees Celsius"

?


Create presentation-quality / stand-alone graph.   Subscribe to WaterAlert      

See this graph on the Monitoring Location Pages


Dissolved oxygen, water, unfiltered, milligrams per liter

Most recent instantaneous value: 7.3 07-12-2025   03:00 CDT
Graph of  Dissolved oxygen, water, unfiltered, milligrams per liter

Add up to 2 more sites and replot for "Dissolved oxygen, water, unfiltered, milligrams per liter"

?


Create presentation-quality / stand-alone graph.   Subscribe to WaterAlert      

See this graph on the Monitoring Location Pages


Nitrate plus nitrite, water, unfiltered, milligrams per liter as nitrogen

Most recent instantaneous value: 1.61 07-12-2025   03:00 CDT
Graph of  Nitrate plus nitrite, water, unfiltered, milligrams per liter as nitrogen

Add up to 2 more sites and replot for "Nitrate plus nitrite, water, unfiltered, milligrams per liter as nitrogen"

?


Create presentation-quality / stand-alone graph.   Subscribe to WaterAlert      

See this graph on the Monitoring Location Pages


Stream water level elevation above NAVD 1988, in feet
 
-- Data temporarily unavailable for the time period specified --


Turbidity, water, unfiltered, monochrome near infra-red LED light, 780-900 nm, detection angle 90 +-2.5 degrees, formazin nephelometric units (FNU)

Most recent instantaneous value: 276 07-12-2025   03:00 CDT
Graph of  Turbidity, water, unfiltered, monochrome near infra-red LED light, 780-900 nm, detection angle 90 +-2.5 degrees, formazin nephelometric units (FNU)

Add up to 2 more sites and replot for "Turbidity, water, unfiltered, monochrome near infra-red LED light, 780-900 nm, detection angle 90 +-2.5 degrees, formazin nephelometric units (FNU)"

?


Create presentation-quality / stand-alone graph.   Subscribe to WaterAlert      

See this graph on the Monitoring Location Pages