PROVISIONAL DATA SUBJECT TO REVISION
Click to hidestation-specific text
Funding for this site is provided by:
 Site Information
LOCATION.--Lat 42°05'52.4", long
74°26'56.7" referenced to North American Datum of
1983, Ulster County, NY, Hydrologic Unit 02020006, on
right bank 10 ft west of County Highway 47 and 10 ft
downstream from bridge on Lost Clove Road, at Big Indian.
DRAINAGE AREA.--29.6 mi².
PERIOD OF RECORD.--October 2016 to current year.
GAGE.--Water-stage recorder and crest-stage gage. Datum of gage is 1,225.27 ft above NAVD of 1988.
REMARKS.--Water Years 2017-22: Records fair except those for estimated daily discharges, which are poor. Water Year 2023: Records poor.
EXTREMES FOR PERIOD OF RECORD.--Maximum discharge, 5,540 ft³/s, Dec. 25, 2020, gage height, 12.06 ft, from rating curve extended above 1,100 ft³/s on basis of slope-area measurement of peak flow; minimum discharge, 2.0 ft³/s, Oct. 16, 2016, gage height, 2.69 ft; minimum gage height, 2.37 ft, Aug. 29, 30, 2022.
 WaterAlert – get an
email or text (SMS) alert based on your chosen threshold.
WaterAlert – get an
email or text (SMS) alert based on your chosen threshold.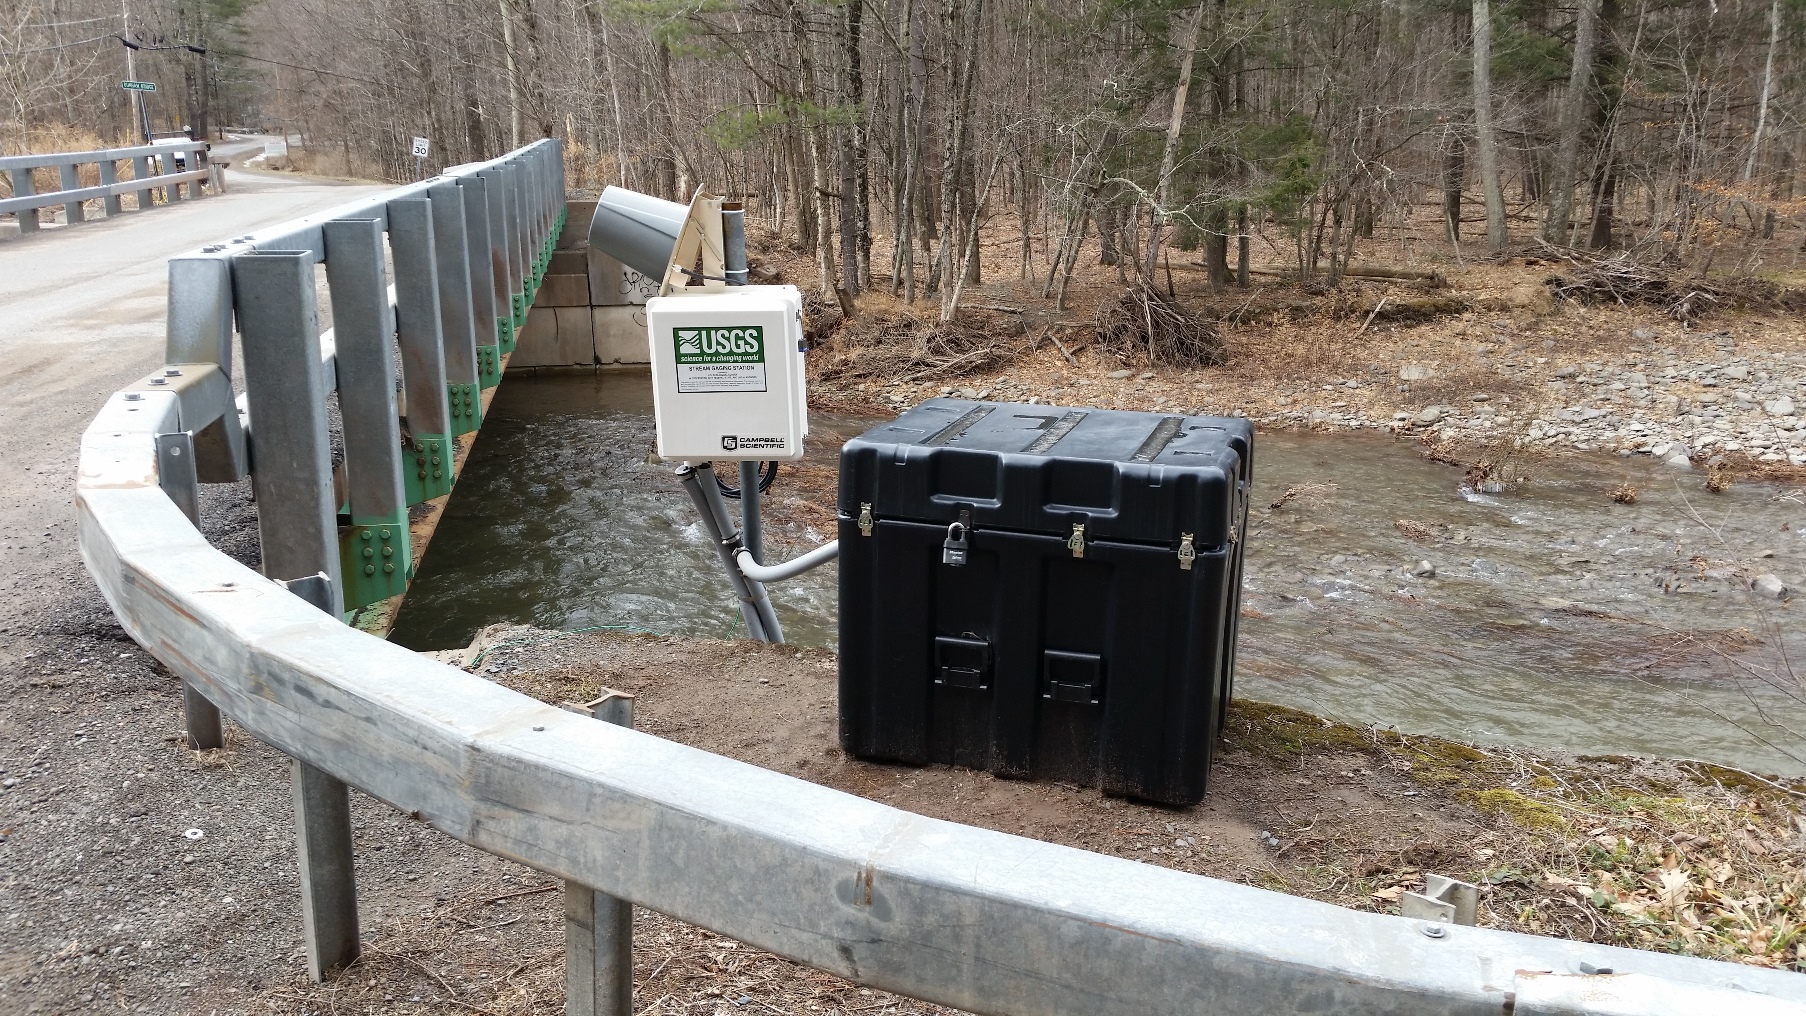 Station image
Summary of all available data for this site
Instantaneous-data availability statement


![Graph of Turbidity, water, unfiltered, monochrome near infra-red LED light, 780-900 nm, detection angle 90 +-2.5 degrees, formazin nephelometric units (FNU), [Observator, Analite NEP 5000 S]](https://nadww01.er.usgs.gov/nwisweb/data/img/USGS.0136219503.335424.63680..20240412.20240419..0..gif)
![Graph of Turbidity, water, unfiltered, monochrome near infra-red LED light, 780-900 nm, detection angle 90 +-2.5 degrees, formazin nephelometric units (FNU), [Forest Technology Systems DTS-]](https://nadww01.er.usgs.gov/nwisweb/data/img/USGS.0136219503.335422.63680..20240412.20240419..0..gif)