USGS 01451400 Spring Creek at Trexlertown, PA

PROVISIONAL DATA SUBJECT TO REVISION

Click to hidestation-specific text
Funding for this site is provided by:


Station gage image
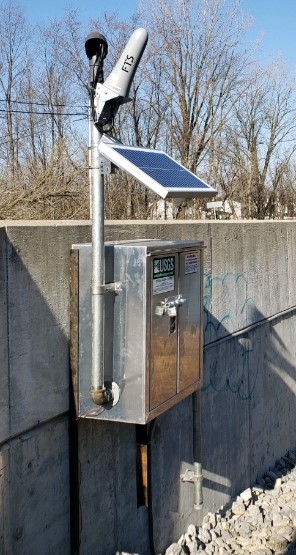
STATION.--01451400 SPRING CREEK AT TREXLERTOWN, PA
LOCATION.--Lat 40`32'03", long 75`36'05", Lehigh County, Hydrologic Unit 02040106, on right bank, downstream side of SR3001 bridge, 530 ft upstream of mouth.
DRAINAGE AREA.--23.7 square miles.
PERIOD OF RECORD.--March 2020 to current year.
GAGE.--Water-stage recorder, crest-stage gage, and water-quality monitor. Datum of gage is 365.9 ft above North American Vertical Datum of 1988 (NAVD88). Prior to October 31, 2022, the datum was erroneously reported as 359 ft above NAVD88. Satellite telemetry at station.
COOPERATION.--Station established and maintained by the U.S. Geological Survey. Funding for the operation of this station is provided by the U.S. Geological Survey.
GAGE HEIGHTS OF IMPORTANCE.-
Supplied by USGS: Maximum recordable gage height (stage sensor operational limit) - 12.2 ft;
This station managed by the PAWSC Downingtown Field Office.

Available Parameters Available Period
  
2020-03-09  2024-04-19
2020-03-09  2024-04-19
2020-03-09  2024-04-19
2020-03-09  2024-04-19
2021-06-15  2024-04-19


 (7)
 

  -- or --


Summary of all available data for this site
Instantaneous-data availability statement


Temperature, water, degrees Celsius

Most recent instantaneous value: 11.2 04-19-2024   04:30 EDT
Graph of  Temperature, water, degrees Celsius

Add up to 2 more sites and replot for "Temperature, water, degrees Celsius"

?


Create presentation-quality / stand-alone graph.   Subscribe to WaterAlert      

See this graph on the Monitoring Location Pages


Discharge, cubic feet per second

Most recent instantaneous value: 68.9 04-19-2024   04:30 EDT
Graph of  Discharge, cubic feet per second

Add up to 2 more sites and replot for "Discharge, cubic feet per second"

?


Create presentation-quality / stand-alone graph.   Subscribe to WaterAlert      

See this graph on the Monitoring Location Pages


Daily discharge, cubic feet per second -- statistics for Apr 19 based on 3 water years of record more
Min
(2021)
25th
percen-
tile
Median Mean Most Recent
Instantaneous
Value Apr 19
75th
percen-
tile
Max
(2022)
21.9 22 24 63 68.9 142 142


Gage height, feet

Most recent instantaneous value: 3.18 04-19-2024   04:30 EDT
Graph of  Gage height, feet

Add up to 2 more sites and replot for "Gage height, feet"

?


Create presentation-quality / stand-alone graph.   Subscribe to WaterAlert      

See this graph on the Monitoring Location Pages


Specific conductance, water, unfiltered, microsiemens per centimeter at 25 degrees Celsius

Most recent instantaneous value: 654 04-19-2024   04:30 EDT
Graph of  Specific conductance, water, unfiltered, microsiemens per centimeter at 25 degrees Celsius

Add up to 2 more sites and replot for "Specific conductance, water, unfiltered, microsiemens per centimeter at 25 degrees Celsius"

?


Create presentation-quality / stand-alone graph.   Subscribe to WaterAlert      

See this graph on the Monitoring Location Pages


Stream water level elevation above NAVD 1988, in feet

Most recent instantaneous value: 369.08 04-19-2024   04:30 EDT
Graph of  Stream water level elevation above NAVD 1988, in feet

Add up to 2 more sites and replot for "Stream water level elevation above NAVD 1988, in feet"

?


Create presentation-quality / stand-alone graph.   Subscribe to WaterAlert      

See this graph on the Monitoring Location Pages