PROVISIONAL DATA SUBJECT TO REVISION
Click to hidestation-specific text
Funding for this site is provided by:
 Site Information
LOCATION.--Lat 42°00'08", long
76°38'05" referenced to North American Datum of 1983,
Chemung County, NY, Hydrologic Unit 02050105, on right bank 100
ft upstream from bridge on State Highway 427, 0.7 mi southwest
of Chemung, and 10.0 mi upstream from mouth.
DRAINAGE AREA.--2,506 mi².
PERIOD OF RECORD.--September 1903 to current year (gage heights only for some winter periods).
REVISIONS HISTORY.--WSP 891: 1935-39. WSP 1432: 1904, 1907, 1915. WSP 2103: Drainage area. WDR NY-74-1: 1973.
GAGE.--Water-stage recorder. Datum of gage is 778.63 ft above Mean Sea Level, Adjustment of 1912 (levels by Corps of Engineers) and 778.66 ft above NAVD of 1988. Prior to Jan. 10, 1930, nonrecording gage on highway bridge 60 ft upstream at same datum.
REMARKS.--High flows significantly regulated by upstream reservoirs: since March 1940, by Arkport Reservoir (01521000); since June 1949, by Almond Lake (01523000); since Nov. 1979, by Tioga Lake (01517900) and Hammond Lake (01518498); and since Dec. 1979, by Cowanesque Lake (01519995). From 1931-98, a large part of flow from 45.5 mi² of drainage area upstream from Lamoka Lake on Mud Creek, an upstream tributary, had been diverted into Keuka Lake (Oswego River basin) for power development.
Water Year 2014: Records good except those for estimated daily discharges, which are fair, and those for May 17 to Aug. 18, which are poor (due to sluggish intakes).
Water Years 2015-24: Records good except those for estimated daily discharges, which are poor.
EXTREMES FOR PERIOD OF RECORD.--Maximum discharge, since construction of Tioga, Hammond and Cowanesque Lakes in 1979, 77,800 ft³/s, Jan. 20, 1996, gage height 19.71 ft; minimum discharge, 104 ft³/s, Sept. 3, 1991; minimum gage height, 2.61 ft, Aug. 9, 10, 2016, Oct. 18, 2020.
EXTREMES FOR PERIOD PRIOR TO REGULATION.--Maximum discharge, prior to construction of Tioga, Hammond and Cowanesque Lakes in 1979, 189,000 ft³/s, June 23, 1972, gage height, 31.62 ft, from floodmark, from rating curve extended above 65,000 ft³/s on basis of slope-area and velocity-area studies at gage height 19.57 ft, and slope-area and contracted-opening measurements at gage heights 23.97 ft and 31.62 ft, respectively; minimum discharge, 49 ft³/s, Aug. 14, 1911, gage height, 1.47 ft.
PERIOD OF DAILY RECORD1.--SUSPENDED-SEDIMENT DISCHARGE: March 1962 to March 1964, August 1974 to September 1977.
EXTREMES FOR PERIOD OF DAILY RECORD1.--SUSPENDED-SEDIMENT CONCENTRATION: Maximum daily mean, 3,050 mg/L, June 20, 1976; minimum daily mean, 1 mg/L, on several days. SUSPENDED-SEDIMENT DISCHARGE: Maximum daily, 402,000 tons, Sept. 26, 1975; minimum daily, 0.85 ton, Sept. 20, 1974, Oct. 13, 1975.
1 Water-Quality Records
 WaterAlert – get an
email or text (SMS) alert based on your chosen threshold.
WaterAlert – get an
email or text (SMS) alert based on your chosen threshold.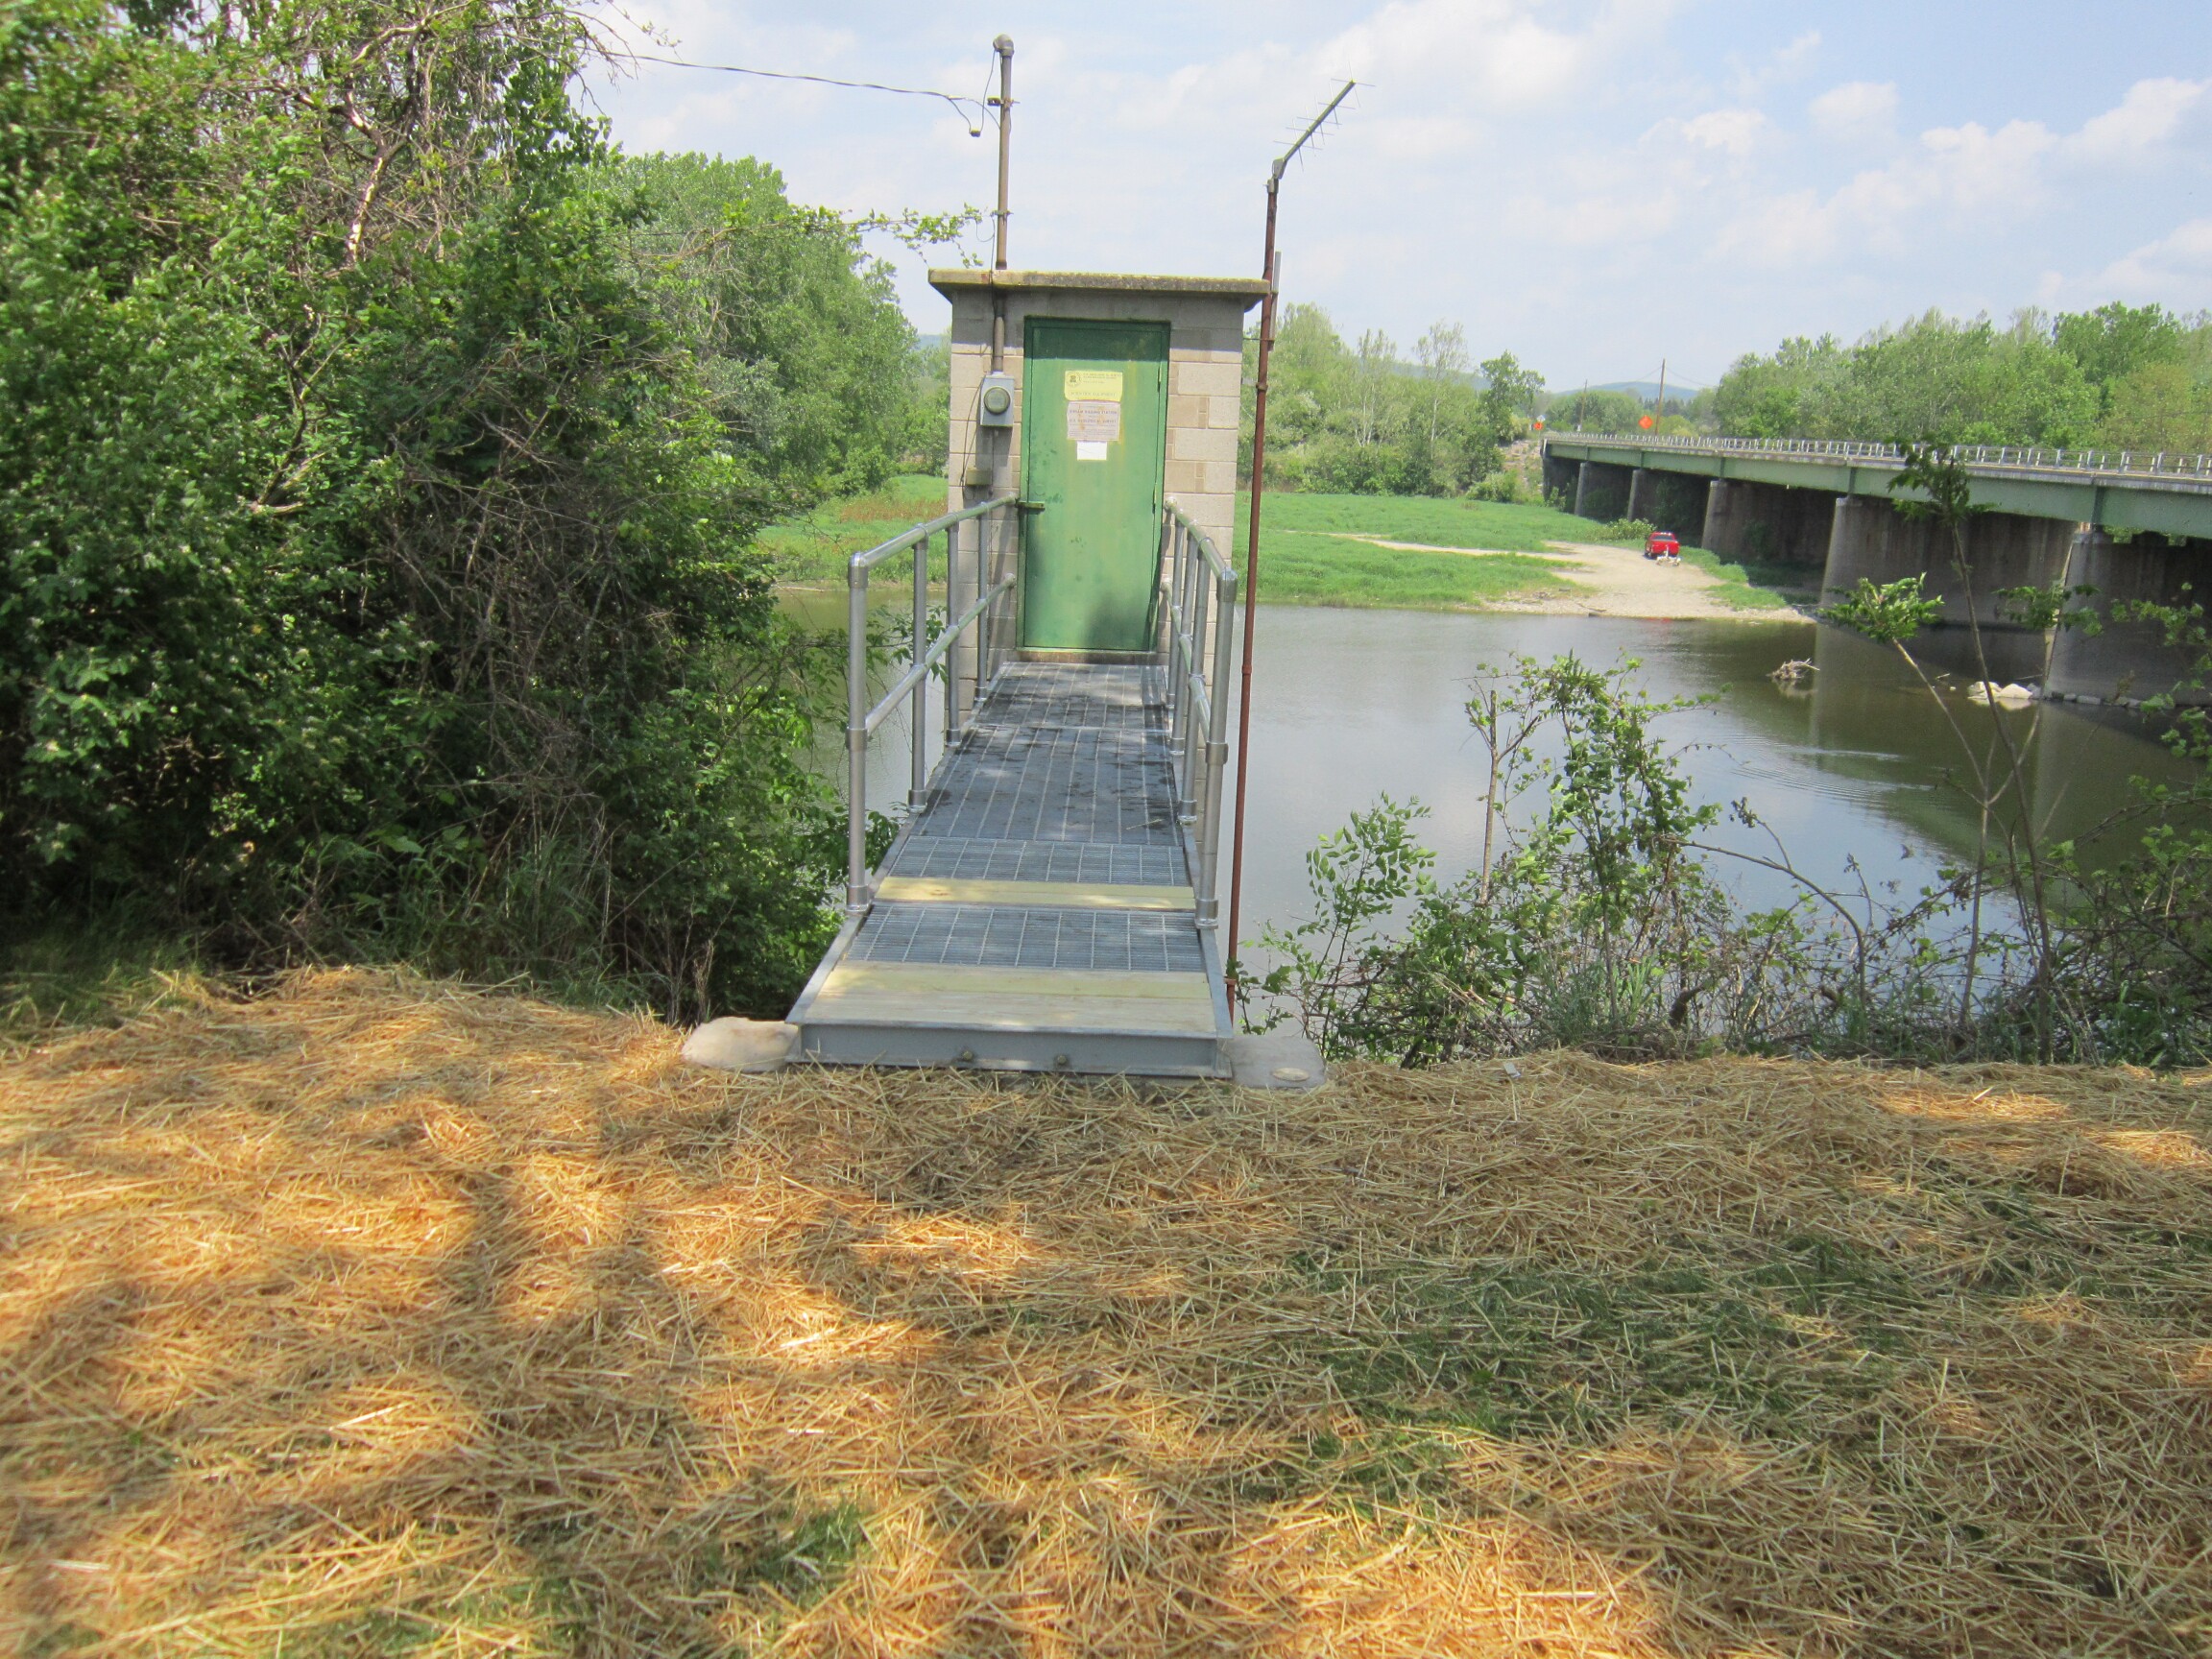 Station image
Summary of all available data for this site
Instantaneous-data availability statement

