USGS 01589197 GWYNNS FALLS NEAR DELIGHT, MD

PROVISIONAL DATA SUBJECT TO REVISION

Click to hidestation-specific text
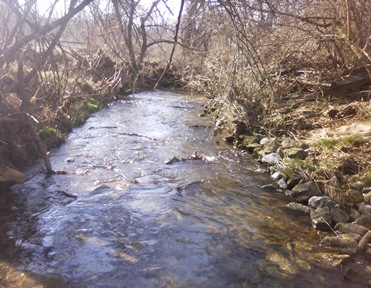
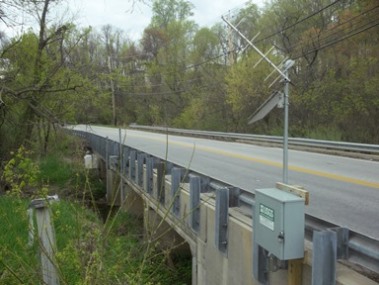
LOCATION.--Lat 39°26'34.6", long 76°47'00.3", Baltimore County, MD, Hydrologic Unit 02060003, 
   on downstream side of bridge on Gwynnbrook Avenue, 1.2 mi east of Delight, and 1.6 mi north of
   Owings Mills.
DRAINAGE AREA.--4.23 mi2.
PERIOD OF RECORD.--October 1998 to current year.
REVISIONS HISTORY.--WDR-US-2011: 1999(P), 2007(P), 2009-2010.
GAGE.--Water-stage recorder and crest-stage gage. Datum of gage is 533.50 ft above North American 
   Vertical Datum of 1988, from digital elevation model.
REMARKS.--U.S. Geological Survey satellite data-collection platform at station.  
EXTREMES FOR PERIOD OF RECORD.--Maximum discharge, 1,760 ft3/s, September 7, 2011, gage height, 8.67 ft;
   minimum discharge, unknown.
COOPERATION.--Funding for the operation of this station is provided by the Baltimore County Department
   of Environmental Protection & Sustainability, and the U.S. Geological Survey.
This station managed by the MD-DE-DC Water Science Center Baltimore office.

Available Parameters Available Period
  
1998-10-01  2024-04-19
2007-10-01  2024-04-19


 (7)
 

  -- or --


Summary of all available data for this site
Instantaneous-data availability statement


Discharge, cubic feet per second

Most recent instantaneous value: 2.72 04-19-2024   16:50 EDT
Graph of  Discharge, cubic feet per second

Add up to 2 more sites and replot for "Discharge, cubic feet per second"

?


Create presentation-quality / stand-alone graph.   Subscribe to WaterAlert      

See this graph on the Monitoring Location Pages


Daily discharge, cubic feet per second -- statistics for Apr 19 based on 24 water years of record more
Min
(2008)
Most Recent
Instantaneous
Value Apr 19
25th
percen-
tile
Median 75th
percen-
tile
Mean Max
(2013)
2.10 2.72 2.9 3.6 4.9 5.5 34.3


Gage height, feet

Most recent instantaneous value: 0.22 04-19-2024   16:50 EDT
Graph of  Gage height, feet

Add up to 2 more sites and replot for "Gage height, feet"

?


Create presentation-quality / stand-alone graph.   Subscribe to WaterAlert      

See this graph on the Monitoring Location Pages