PROVISIONAL DATA SUBJECT TO REVISION
Click to hidestation-specific text
Funding for this site is provided by:
 Site Information
LOCATION.--Lat 42°37'39.7", long
77°09'32.1" referenced to North American Datum of
1983, Yates County, NY, Hydrologic Unit 04140201, on right bank
of bridge on County House Road, 5.6 mi southwest of Penn Yan,
and 2.5 mi upstream from mouth into Keuka Lake.
DRAINAGE AREA.--24.4 mi².
PERIOD OF RECORD.--April 2019 to current year.
GAGE.--Water-stage recorder and crest-stage gage. Datum of gage is 745.70 ft above NAVD of 1988.
REMARKS.--Water Years 2019-23: Records good except those for estimated daily discharges and those below 1.0 ft³/s, which are poor.
EXTREMES FOR PERIOD OF RECORD.--Maximum discharge, 701 ft³/s, Oct. 30, 2021, gage height, 7.13 ft; minimum discharge, 0.03 ft³/s, Sept. 20, 2020, gage height, 2.12 ft; minimum gage height, 2.09 ft, Aug. 3, 2022.
 WaterAlert – get an
email or text (SMS) alert based on your chosen threshold.
WaterAlert – get an
email or text (SMS) alert based on your chosen threshold.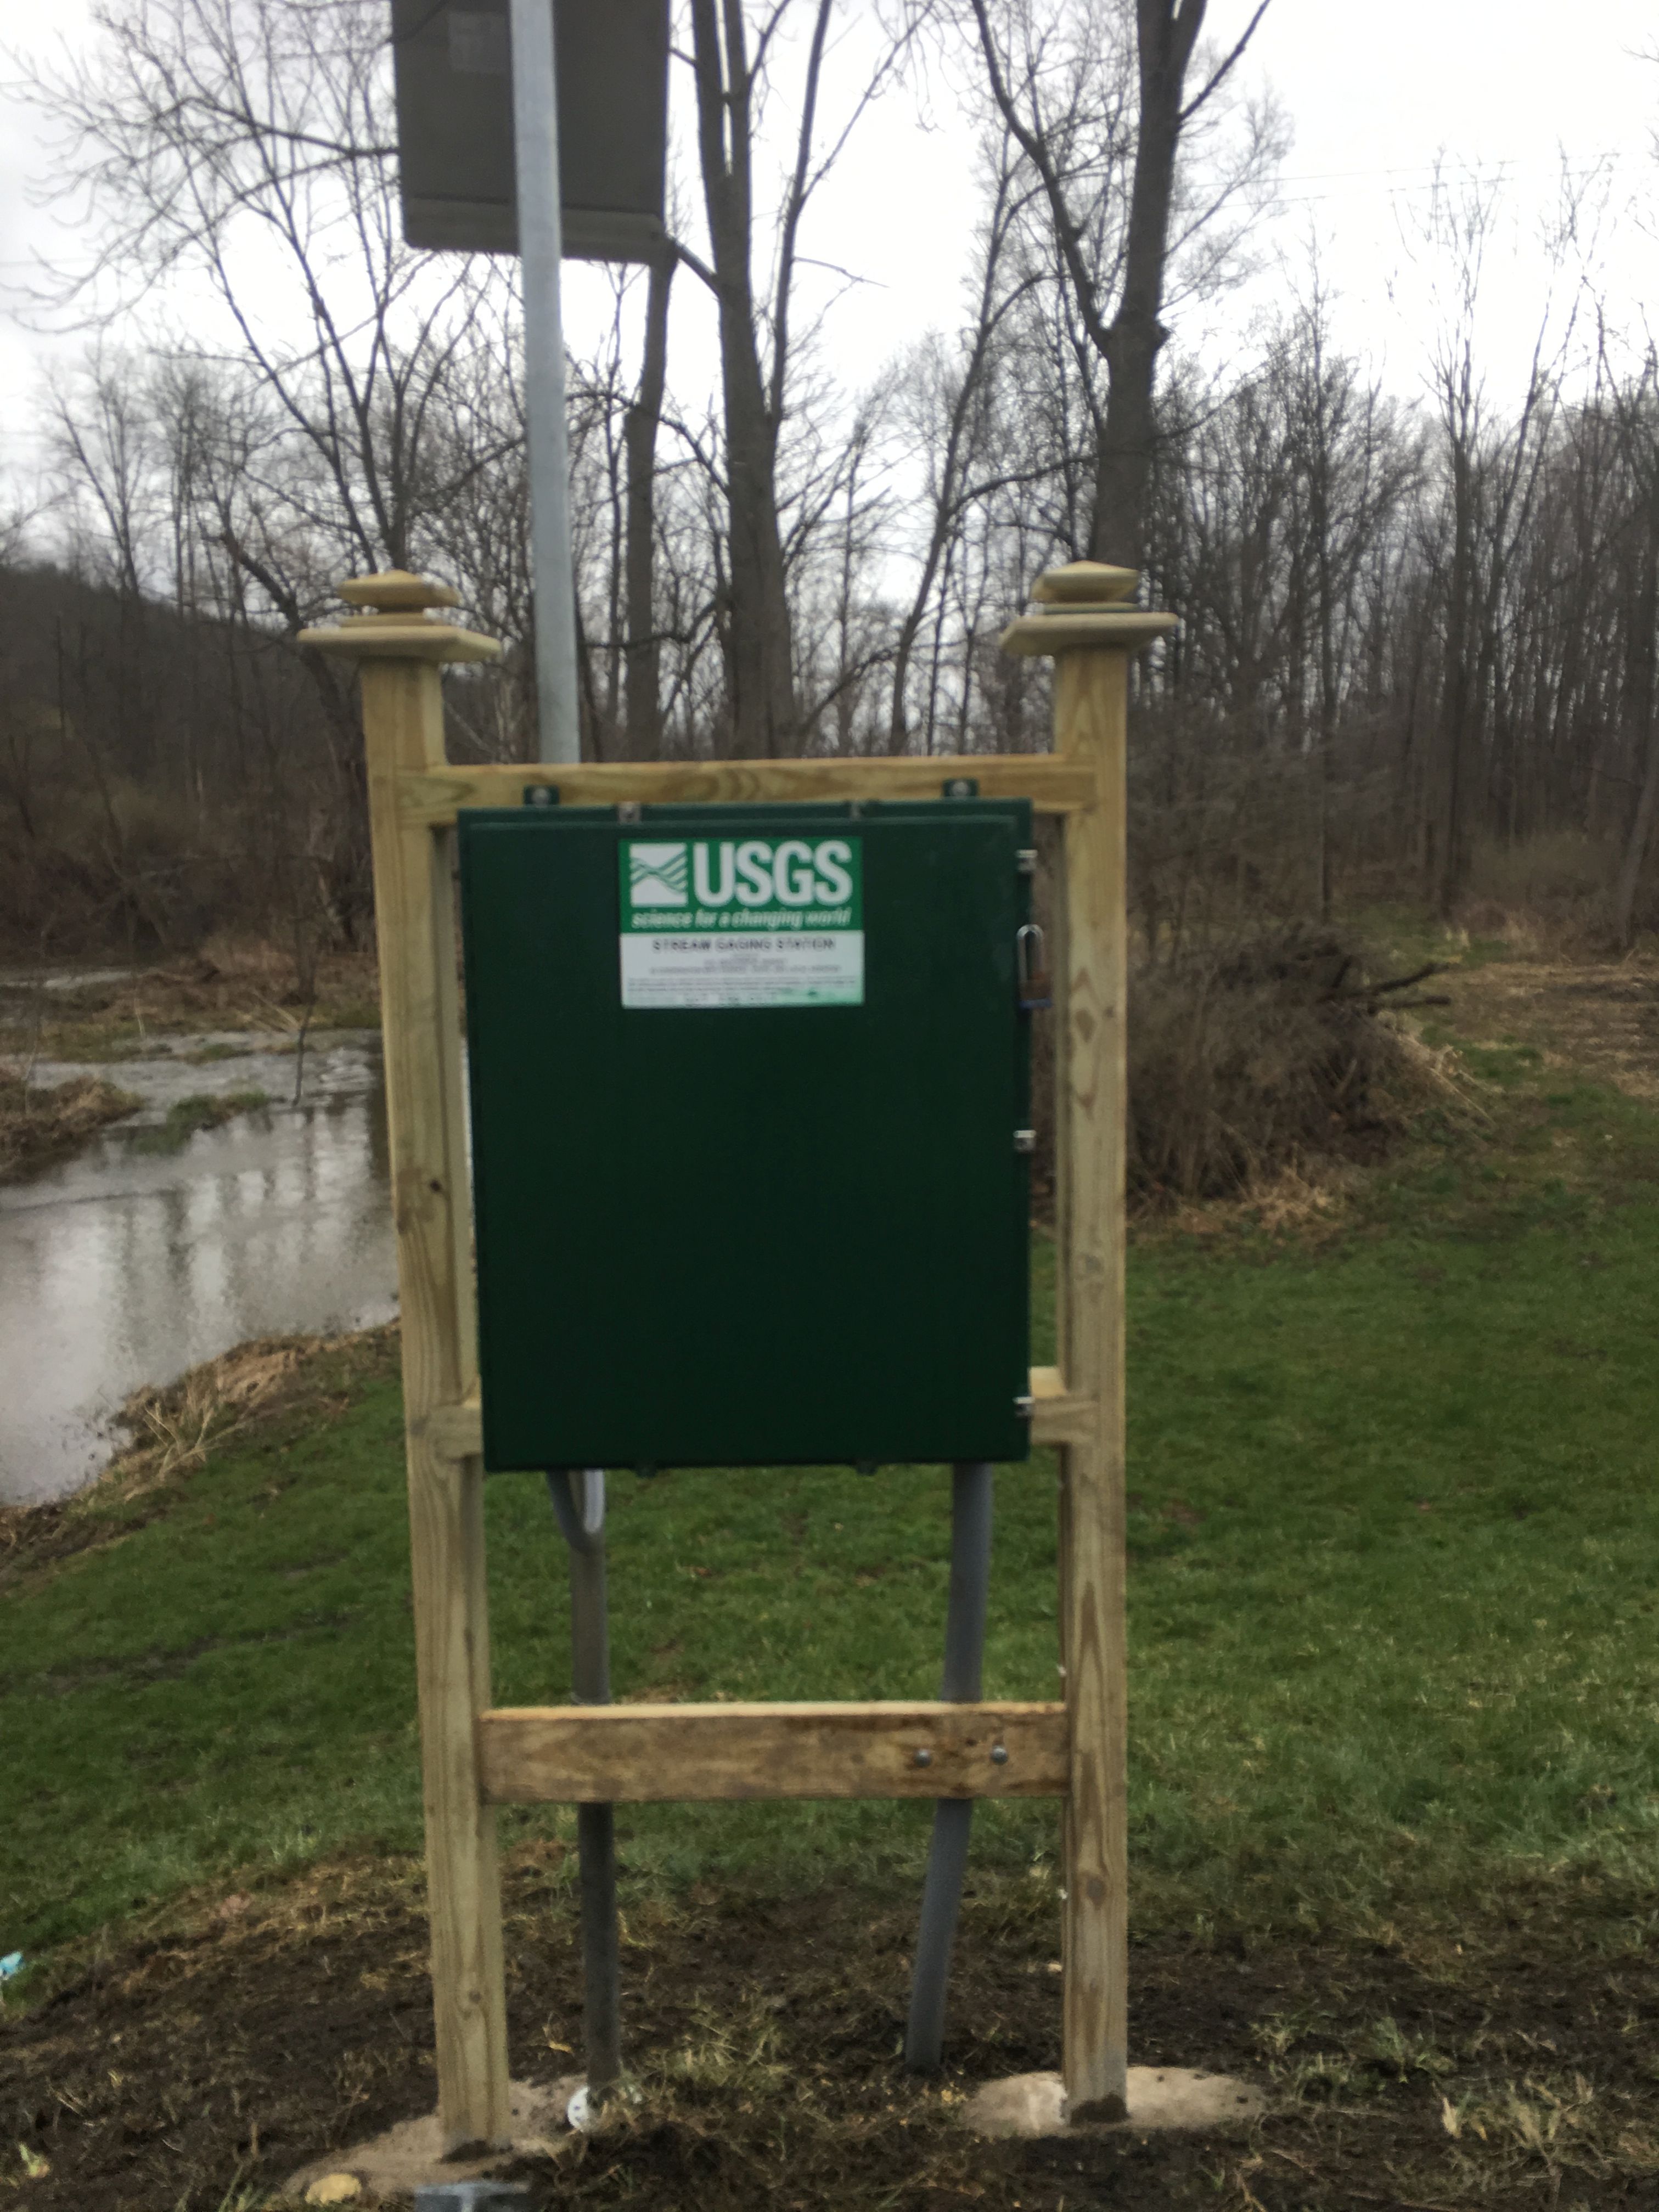 Station image
Summary of all available data for this site
Instantaneous-data availability statement

